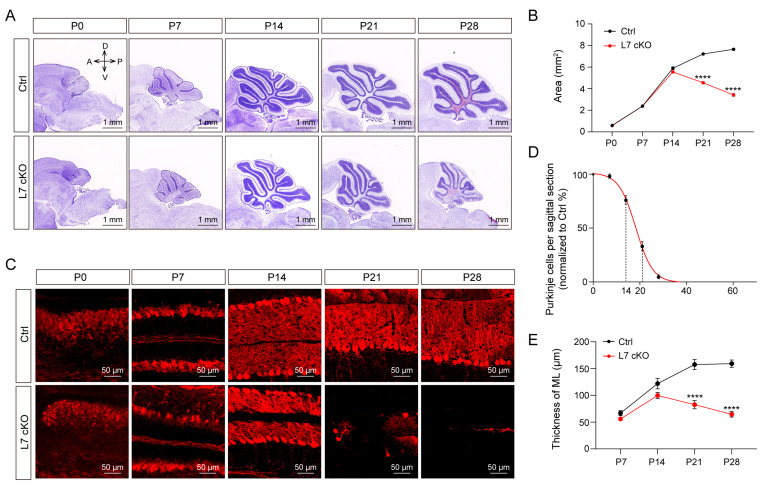
Figure 1.
Loss of OGT in PCs induces cerebellar atrophy and PCs loss. (A) Nissl staining of sagittal histological sections of the cerebellar vermis showing cerebellar atrophy (scale bar: 1 mm). (B) Quantification of the area of the sagittal sections of the cerebellar vermis for the Ctrl and cKO mice (mean ± SEM; **** p < 0.0001, n > 3). (C) Immunofluorescent staining with anti-calbindin antibody (red) to reveal PCs in the cerebellar vermis (scale bar: 50 μm). (D) PCs per sagittal histological section of the cerebellar vermis is expressed as a percentage for the Ctrl mice. (E) The ML thickness of the cKO and Ctrl mice (mean ± SEM; **** p < 0.0001, n > 3). a, anterior; d, dorsal; p, posterior; v, ventral; ML, molecular layer.

