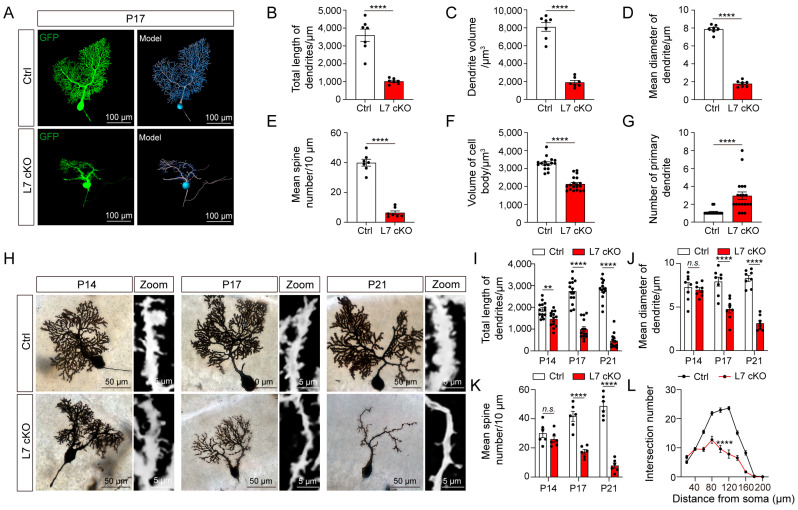
Figure 3.
PCs were degenerated in the cKO mice. (A) The cerebella of the Ctrl and cKO mice were infected with a virus, and infected positive PCs exhibited by GFP (green) and the reconstruction of PCs using Imaris are shown (scale bar: 100 μm). (B-G) Morphometric analyses of the total length of dendrites (B), dendrite volume (C), dendrite mean diameter (D), spine density (E), volume of the cell body (F) and number of primary dendrites (G) of PCs (mean ± SEM; **** p < 0.0001, n > 5). (H) The morphology of the PCs after Golgi impregnation (scale bar: 50 μm). A zoom showing a high-magnification picture of the PC dendrites (scale bar: 5 μm). (I–K) Quantification of the total length of the dendrites (I), dendrite mean diameter (J) and spine density (K) (mean ± SEM; ** p < 0.01, **** p < 0.0001, n.s. = no significance, n > 5). (L) Sholl analysis of the intersection number of the dendrites at different distances from the cell body of the PCs in the Ctrl and cKO mice (mean ± SEM; **** p < 0.0001, n > 5).

