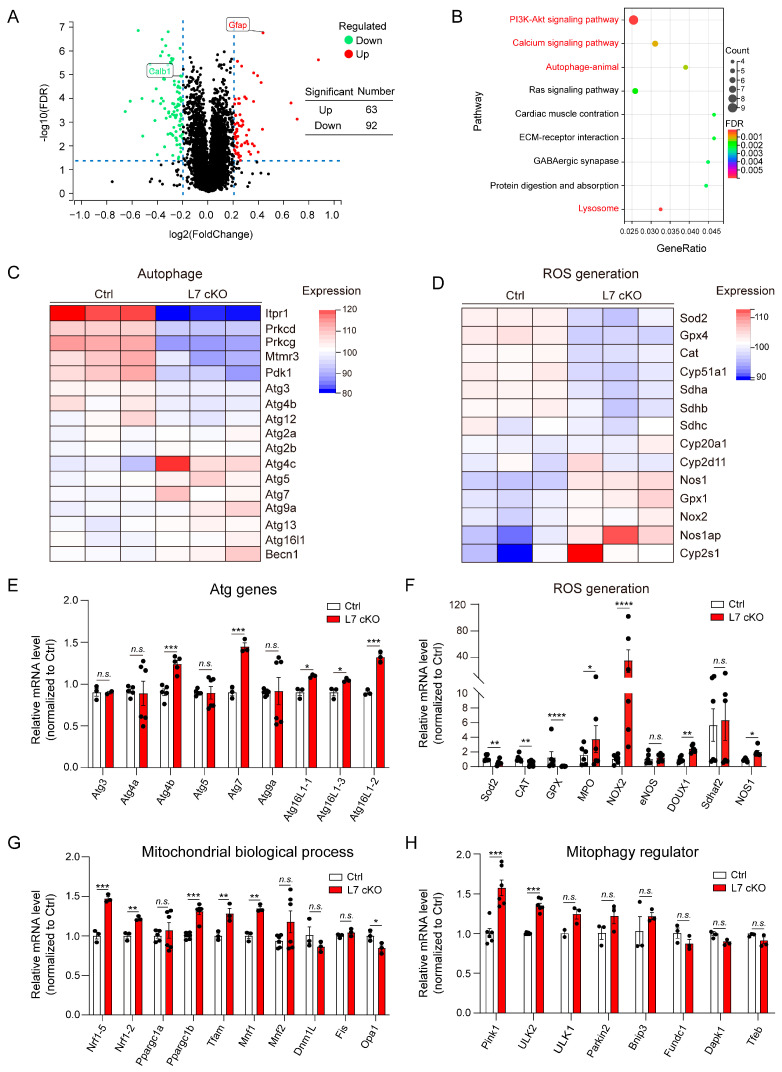
Figure 4.
Ablation of OGT in PCs induces changes in the gene expression of mitochondrial autophagy and ROS accumulation in cKO mice. (A) Volcano map of differentially expressed proteins analyzed using TMT in the cerebellum of the Ctrl and cKO mice. (B) Curated KEGG pathway terms of up- or down-regulated proteins in the cerebellum of the cKO mice compared with Ctrl mice. The pathways closely related to autophagy are marked in red. (C,D) Heatmap of the expression of proteins in autophagy (C) and ROS generation (D) signaling pathways. The mean expression levels in the heatmap were standardized by taking the z-score within each row (n = 3). The top bar indicates the genotypes of the samples. (E,F) Quantitative RT-PCR analysis indicates significant changes in Atg-related genes (E) and ROS generation (F) in the cerebellum of the Ctrl and cKO mice (mean ± SEM; * p < 0.05, ** p < 0.01, *** p < 0.001, **** p < 0.0001, n.s. = no significance, n > 3). (G,H) Quantitative RT-PCR analysis indicates significant changes in mitochondrial biological processes-related genes (G) and mitophagy-related genes (H) in the cerebellum of the Ctrl and cKO mice (mean ± SEM; * p < 0.05, ** p < 0.01, *** p < 0.001, **** p < 0.0001, n.s. = no significance, n > 3).

