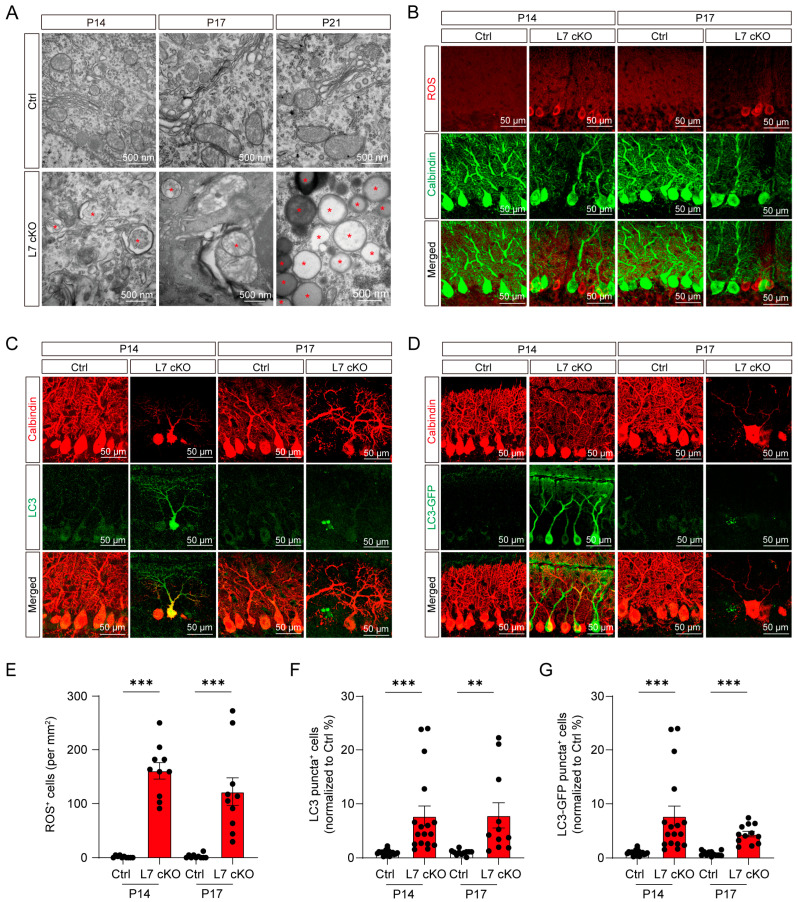
Figure 5.
Mitochondrial damage with ROS and LC3 accumulation in OGT-deficient PCs. (A) Electron micrographs of PCs from the Ctrl and cKO mice at P14, P17 and P21, respectively. Autophagosome-like structures (labeled with asterisks) in PCs are labeled (scale bar: 500 nm). (B) The fluorescence plots show that ROS (red) were significantly elevated in the PL (scale bar: 50 μm). (C) Co-immunofluorescent staining with anti-LC3 and anti-calbindin antibodies showing the significantly increased LC3 expression (scale bar: 50 µm). (D) Immunofluorescence analysis of the cellular localization of LC3 (green) and immunofluorescent staining with anti-calbindin antibody (red) (scale bar: 50 μm). (E) Quantification of the ROS fluorescence intensity of the PL from the Ctrl and cKO mice (mean ± SEM; *** p < 0.001, n = 10). (F) Quantification of the LC3 puncta-positive cells from the Ctrl and cKO mice at P14 and P17 (mean ± SEM; *** p < 0.001, ** p < 0.01, n > 10). (G) Quantification of LC3 puncta-positive cells among PCs from the Ctrl and cKO mice at P14 and P17 (mean ± SEM; *** p < 0.001, n > 10).

