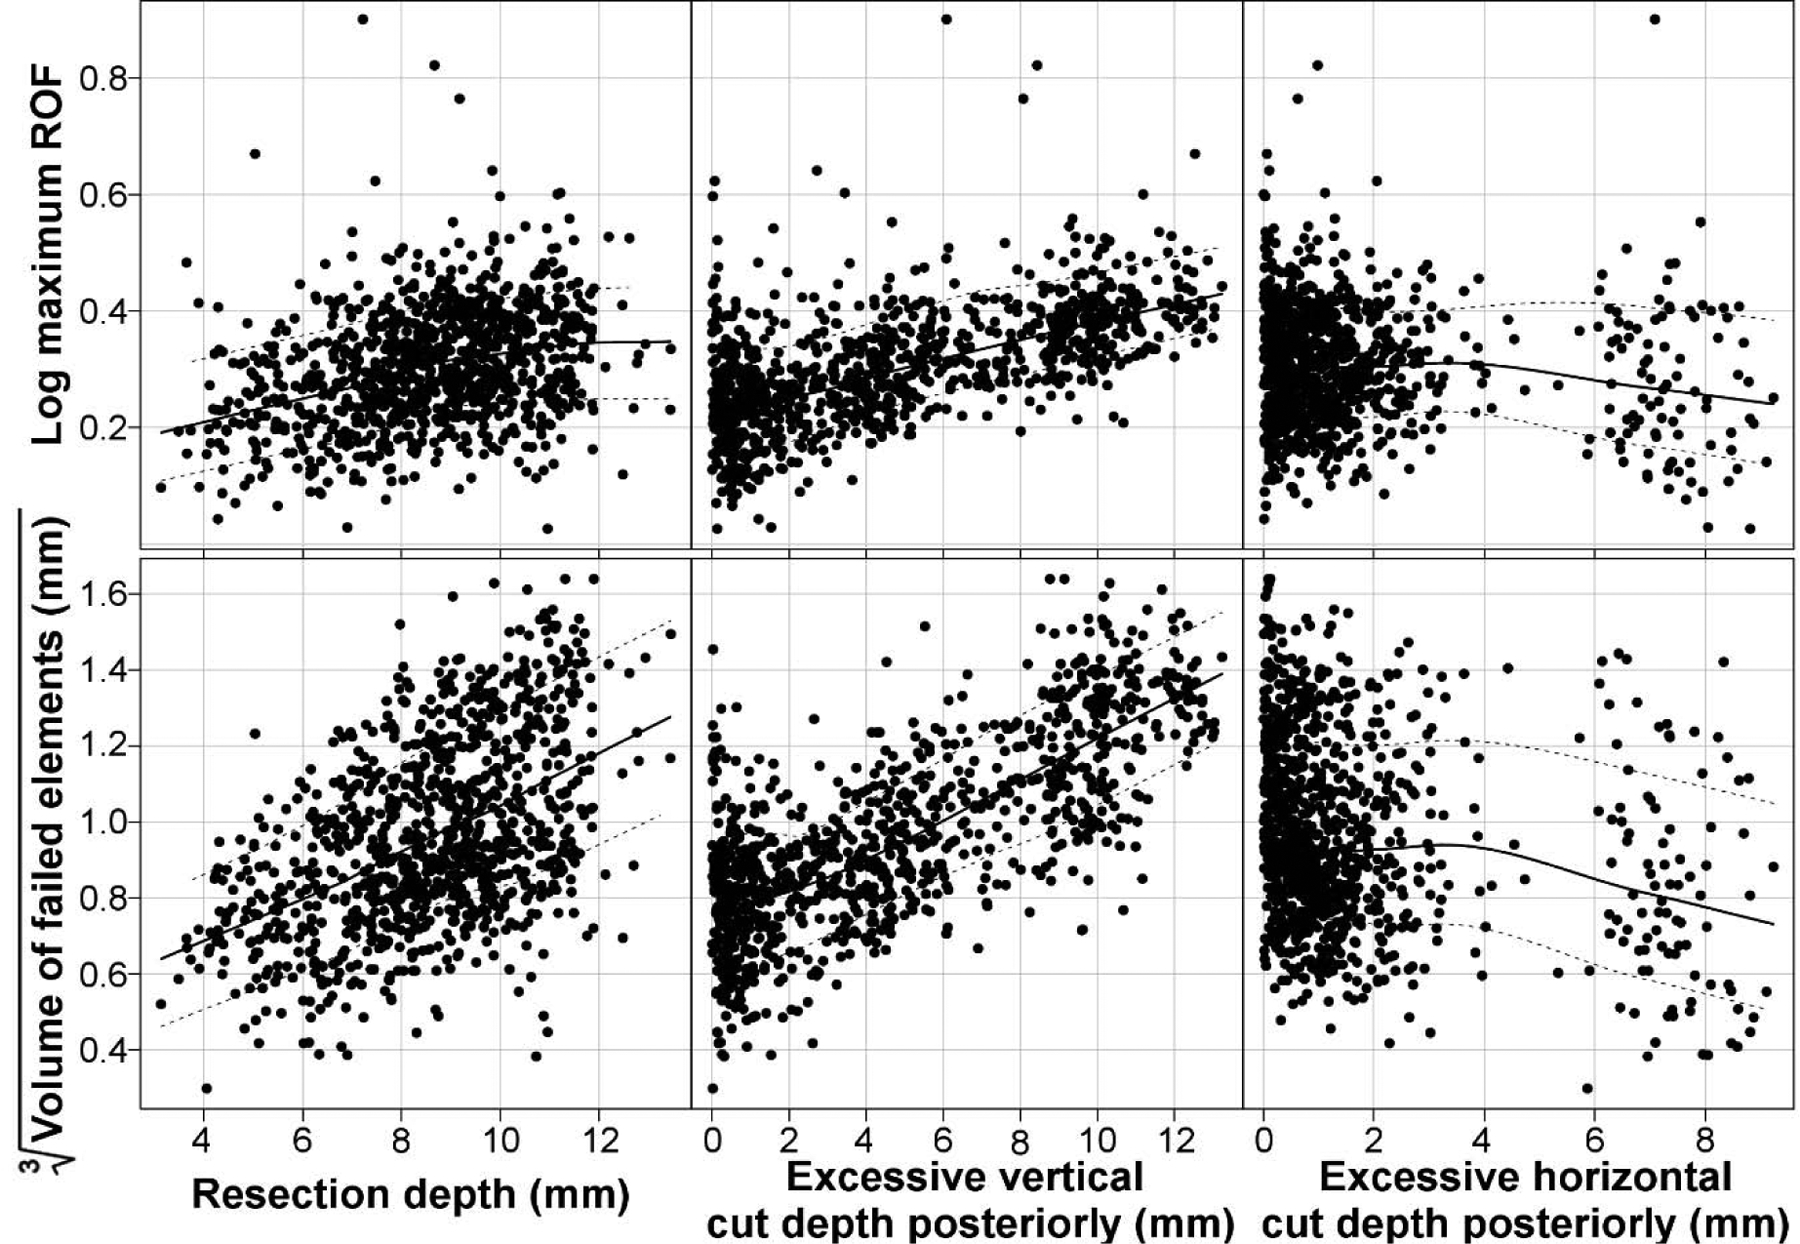
Figure 4.

Scatterplots of regression parameters which were found to significantly influence the maxim ROF value (log) and volume of failed elements (cube root). The lines in each plot represent the mean and the interquartile range.

Scatterplots of regression parameters which were found to significantly influence the maxim ROF value (log) and volume of failed elements (cube root). The lines in each plot represent the mean and the interquartile range.