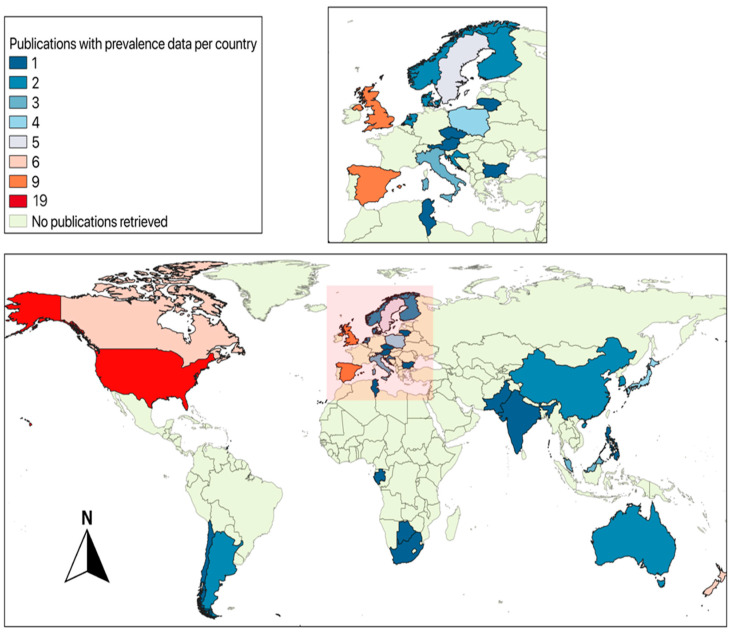
Figure 1.
Global map (made it with QGIS 3.4 software [149]) representing the number of publications with Campylobacter prevalence in wildlife per country. The number of publications per country are color-coded as per the index and the top left of the figure. The area shaded in the box at the bottom of the figure is shown in more detail in the top right corner of the figure due to the close geographical proximity of many of the European nations in which papers on the topic have been published.

