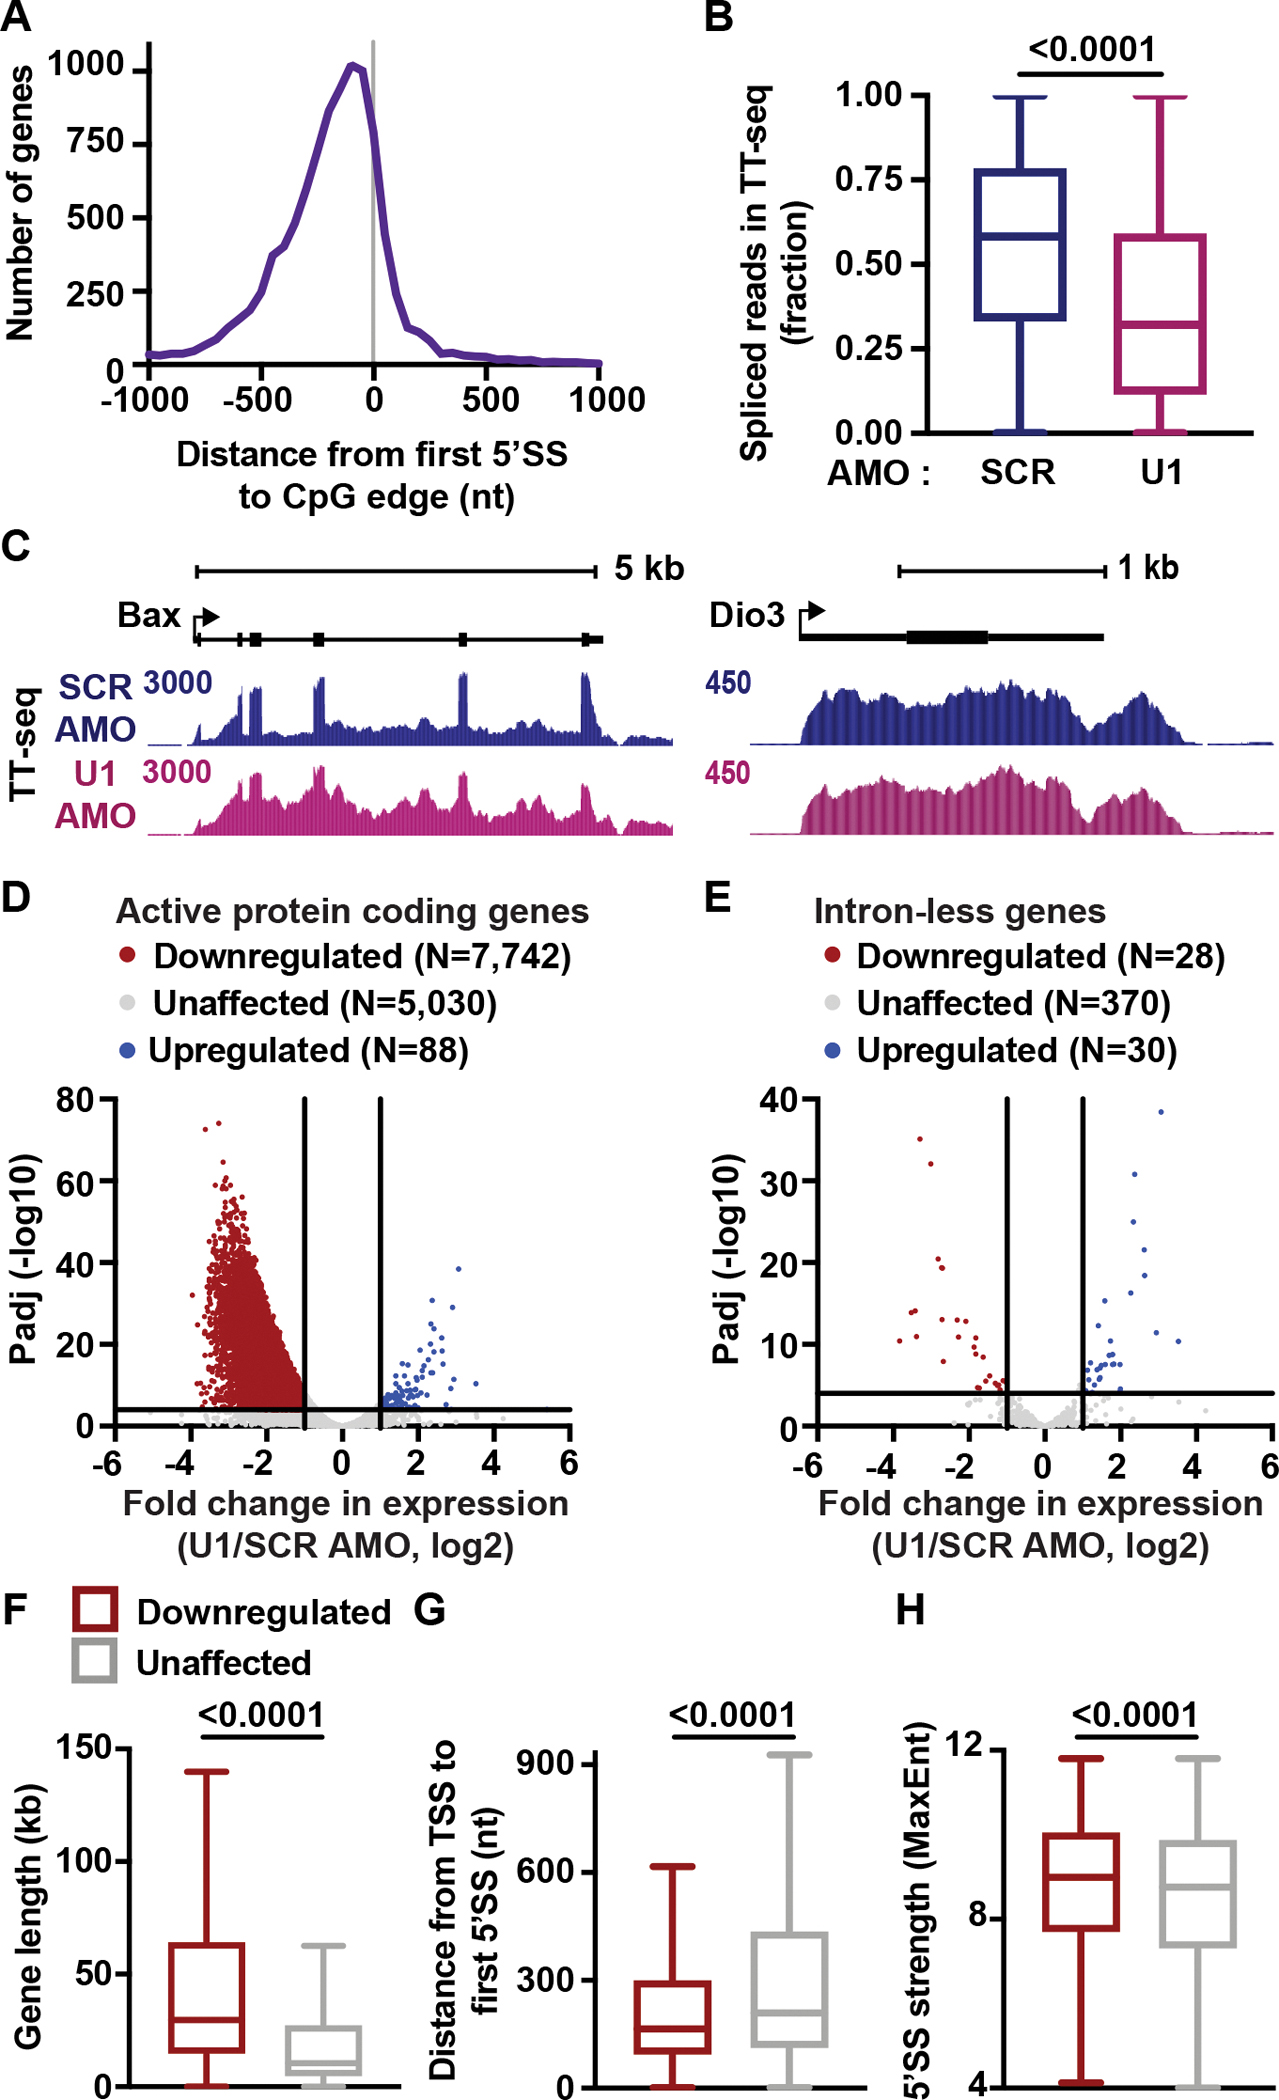
Figure 2. Inhibition of U1 broadly decreases expression of intron-containing genes.

(A) Histogram reporting the distance between 5’SS and CpG edge for genes in Figure 1C. A negative distance indicates that the first 5’SS is upstream of the CpG edge.
(B) Splicing efficiency (SE) for first introns in protein coding genes was calculated as the number of spliced reads divided by the total number of spliced and unspliced reads per intron. The distribution of SE is shown per condition as a box plot. P-values from Wilcoxon test.
(C) TT-seq signal at example genes that have (left) or lack (right) introns.
(D) Volcano plot depicting differentially expressed genes in U1 AMO cells. TT-seq reads were calculated within exons and U1-affected genes were defined by DESeq2 (p <0.0001 and Fold Change >2).
(E) Same as (D) but highlighting intron-less genes.
(F-H) Box plots report the distribution of (F) gene lengths, (G) distances between the TSS and first 5’SS, and (H) the MaxEnt score for first 5’SSs at downregulated and unaffected genes. P-values from Mann-Whitney test.
