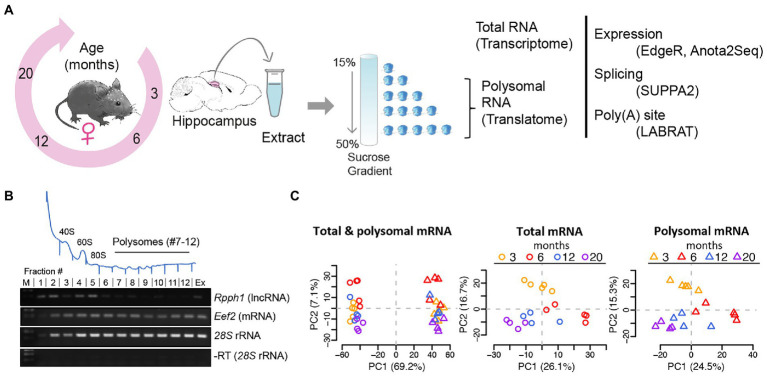
Figure 1.
Analysis of mRNA translation by sucrose density gradients and RNA-sequencing. (A) Experimental scheme: hippocampi from female mice aged 3, 6, 12, and 20 months were collected, extracts prepared and fractionated on sucrose gradients. Total RNA samples and polysomal RNA samples were sequenced, representing the transcriptome and translatome, respectively for further analysis (B) Representative absorbance profile at 254 nm across a sucrose gradient from hippocampi (on top). Positions of the 40S and 60S ribosomal subunits, 80S monosomes, and polysomes are indicated. Fractions 7–12 of the polysomes were collected for RNA-seq representing the translatome. Bottom: RT-PCR with isolated RNA from fractions #1–12 of the sucrose gradient. Extract (Ex) refers to total RNA isolation corresponding to the transcriptome; (M) molecular weight marker. Rpph1: long non-coding RNA (lncRNA) not expected to be translated; Eef2: eukaryotic elongation factor 2 mRNA and 28S rRNAs are expected to be present in all fractions including polysomes. A negative control PCR reaction without RT for 28S rRNA is shown at the bottom. (C) PCA after outlier removal and batch correction of all samples (n = 36; left column), total mRNA samples (n = 18, circles), and polysomal mRNA samples (n = 18, triangles). Samples are colored by age. The component percentages are indicated in brackets.

