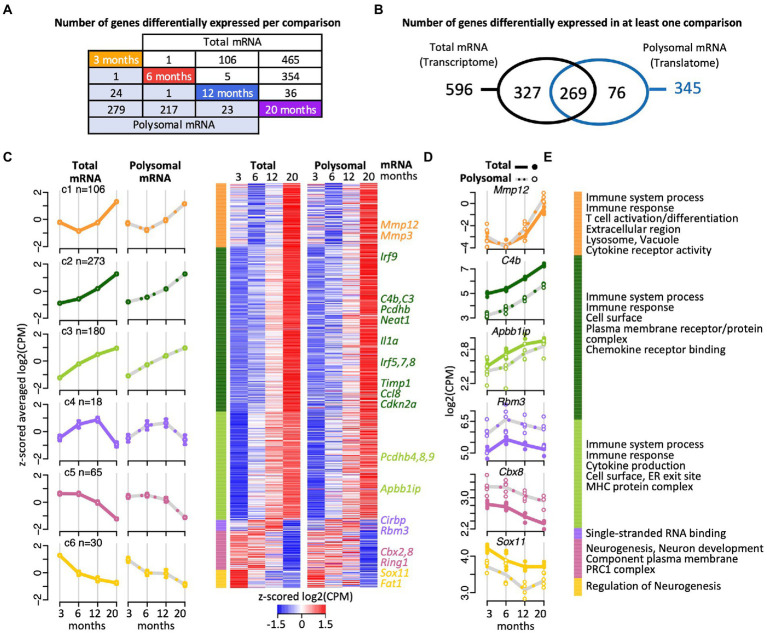
Figure 2.
Gene expression trajectories in the transcriptome and translatome across four age groups identified with edgeR. (A) Scheme depicting the number DEGs in the transcriptome (total RNA) and translatome (polysomal RNA) across all pairwise time comparisons. (B) Venn diagram representing overlap of DEGs in the transcriptome and translatome. (C) Cluster heatmap and averaged temporal profiles of expression for the 672 DEGs identified in the transcriptome and translatome. The log2(CPM) values for each gene in a single age group were averaged to generate z-scored mean profiles, and six clusters (C1–C6; marked in different colors) were identified with the Bayesian Index Criterion based on the total RNA (transcriptome) data. The corresponding polysomal RNA (translatome) data are displayed to the right. The average profiles for each cluster are shown to the left with a continuous line for total RNA, a gray dashed line for polysomal RNA, and error bars showing 95% confidence intervals (CI). The number of genes within each cluster is indicated (n). (D) Expression levels (log2(cpm)) of selected genes. Total mRNA; solid line displays the mean and closed circle refer to individual samples. Polysomal mRNA; gray dotted line is the mean and open circles show individual values. (E) Enriched Gene Ontology (GO) terms for each cluster. The dataset with functional annotations is provided in Supplementary Table 2.

