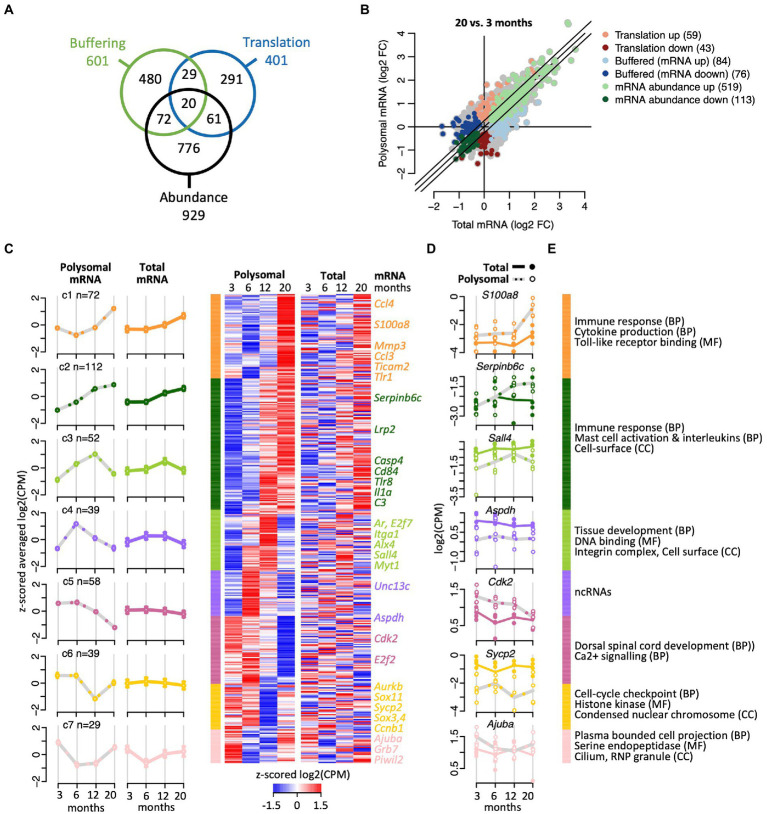
Figure 3.
Translational efficiency analysis identifying age-related changes of mRNA expression. (A) Venn diagram shows overlap of numbers of transcripts identified with anota2seq across the indicated three regulatory modes. (B) Fold-changes (FC) in total mRNA (x-axis) and polysomal mRNA levels (y-axis) of 20-month-old vs. 6-month-old mice. Colors depict genes allocated to the three regulatory modes. Number of genes is indicated within brackets. (C) Cluster heatmap and averaged temporal profiles of genes displaying alteration in the ‘translation’ regulatory mode during aging (n = 401 genes). Clustering was based on the polysomal RNA (translatome) profiles; corresponding total RNA (transcriptome) data is displayed to the right. Average profiles for each cluster are shown to the left with a continuous line for total RNA, a gray dashed line for polysomal RNA, and error bars marking 95% CI. (D) Expression levels (log2(cpm)) of selected genes. Total mRNA; solid line displays the mean and closed circles refer to individual samples. Polysomal mRNA; gray dotted line is the mean and open circles show individual values. (E) GO terms enriched with each cluster. GO categories: BP, biological process, CC, cellular compartment, MF, molecular function. The complete dataset including GO annotations is given in Supplementary Table 1.

