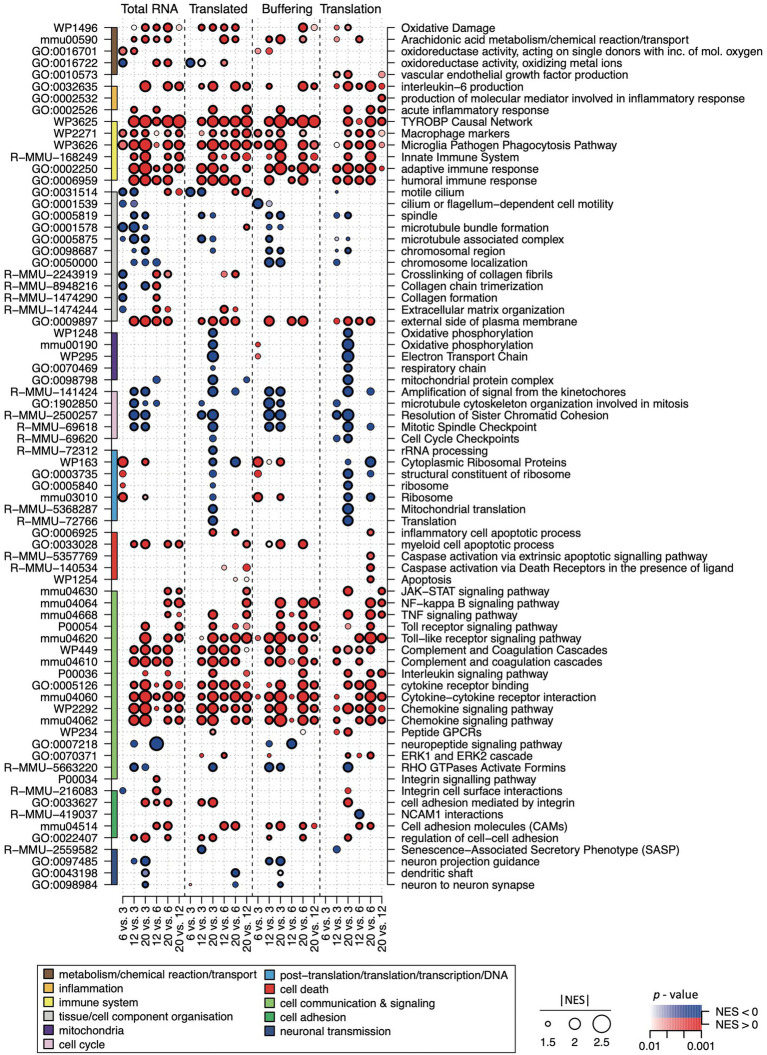
Figure 4.
GSEA of the transcriptome (“Total RNA”), translatome (“Translated”) and the “Buffering” and “Translation” regulatory modes defined with anota2seq. 74 significantly enriched terms (left: ID numbers) across time comparisons (bottom horizontal axis) are shown. Normalized enrichment scores (|NES|) for each term are displayed and are proportional to the circle size. The colormap refers to p-values indicated at the bottom, circles with a black border line refer to terms with FDR < 0.05. Red: terms associated with up-regulated genes (+ NES score); blue: terms associated with down-regulated genes (− NES score). 74 terms were manually allocated to 11 functional classes (colors in left vertical axis) and described in the bottom right legend.

