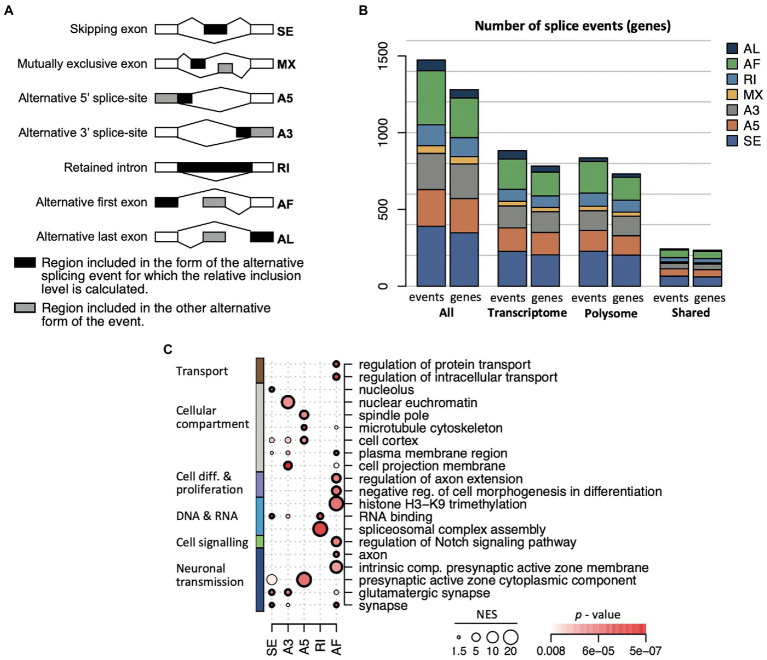
Figure 6.
AS event types in the transcriptome and translatome. (A) Scheme of the seven different event types identified with the SUPPA2 analysis. The relative inclusion levels (Ψ) concern the region depicted in black; a gray area indicates alternative forms of the event. (B) Number of events and genes associated with each of the seven event types across the transcriptome and translatome (polysome). (C) Selection of 20 enriched themes overrepresented among genes displaying different splicing event types. The diameter of the circle is proportional to the NES score, the colormap refers to the p-value, circles in bold refer to FDR < 0.05.

