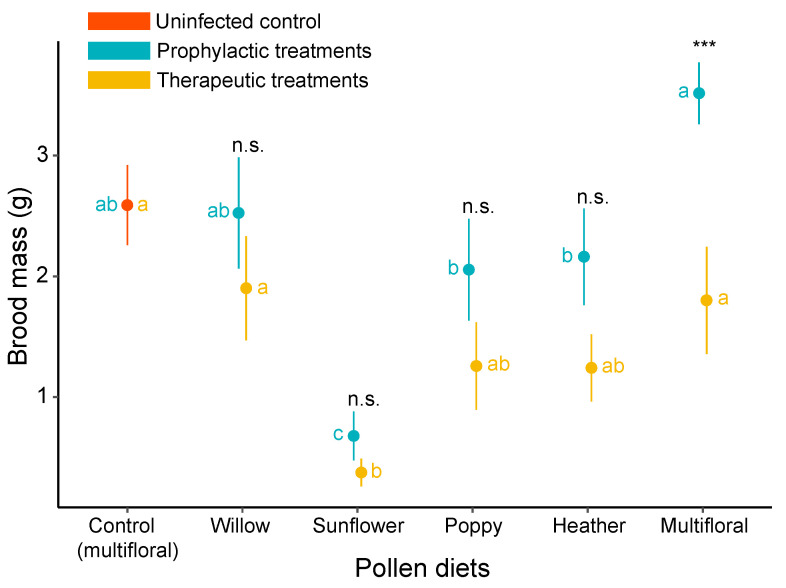
Figure 3.
Effects of treatments on the total mass of hatched offspring in B. terrestris micro-colonies. Data in blue represent the prophylactic treatments, data in gold represent the therapeutic treatments, and data in orange represent the uninfected control (i.e., uninfected microcolonies fed on multifloral pollen). Points are mean values of each treatment and error bars indicate the standard error of means. Letters indicate significance at p < 0.05; blue letters refer to comparison across pollen diets within prophylactic treatments, gold letters refer to comparisons across pollen diets within therapeutic treatments, and statistical significance code refers to comparison between treatments (prophylactic vs. therapeutic) (n.s., p > 0.05; ***, p < 0.001). Pairwise comparisons were performed based on a priori contrasts.

