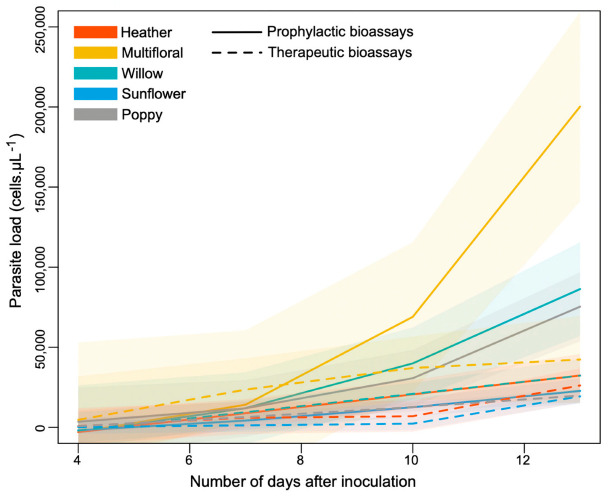
Figure 5.
Dynamics of infection within B. terrestris microcolonies. The color code refers to the pollen diet, and the line type refers to the bioassay categories. Generalized additive mixed effect models (GAMMs) were used to fit smoothers to the data showing mean trends (±95% confidence intervals) over time.

