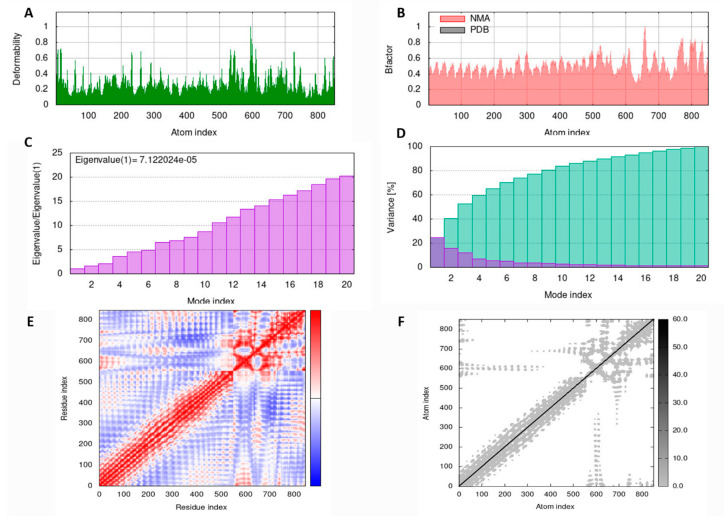
Figure 5.
MD simulation results of LSDV-V2 and TLR4 complex obtained by iMODS server. (A) deformability (B) NMA mobility (C) eigenvalues (D) purple in the bar shows the individual variances and green depicts cumulative variances (E) Covariance map specifies correlated (red), uncorrelated (white), and anti-correlated (blue) motions of paired residues and (F) The elastic network model (grey regions indicate stiffer regions).

