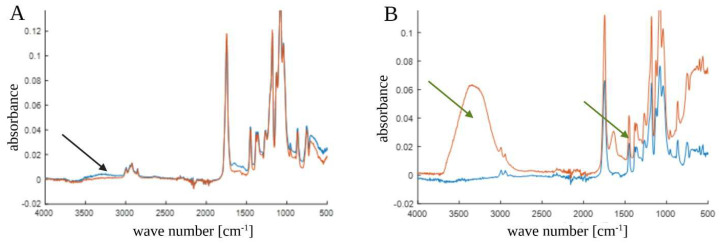
Figure 3.
(A) Fourier transform infrared (FT-IR) spectrum of poly(ε-caprolactone) (PCL) samples. The black arrow indicates that there was no interaction in the ester group between the unsterilized PCL (blue line) and sterilized PCL (red line) samples. (B) FT-IR spectrum of PCL compounded with beta-tricalcium phosphate 20% (PCL+β-TCP 20%) samples. The green arrows indicate the interactions in the ester group between the unsterilized composite (blue line) and the sterilized composite (red line) samples.

