Figure 2.
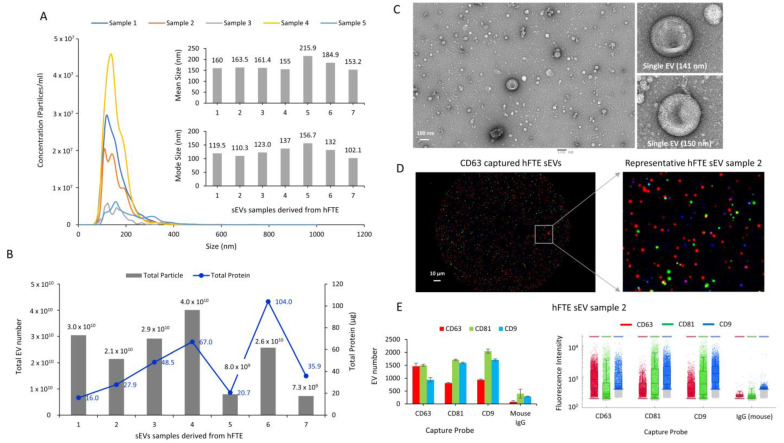
The physical and molecular characterization of sEVs derived from hFTE cultured in the PREDICT-MOS. (A) The size profile of sEVs was quantified using nanoparticle-tracking analysis (NTA). NTA graphs of five representative samples are shown. Inset shows the mean size and mode size of sEVs from seven patient samples. (B) The total sEV number and total protein content in sEVs quantified via NTA and the Bradford assay, respectively. (C) The transmission electron microscopy (TEM) image of sEVs shows cup-shaped morphological properties. Inset shows the micrograph of a single sEVs (Scale bar: 100 nm). (D) The image of sEVs captured by the CD63 capture probe in ExoView chip, and detected by CD63 (red), CD81 (green), and CD9 (blue) antibodies (Scale bar: 10 µm). (E) The molecular characterization of sEVs quantifying CD63/CD81/CD9-positive sEVs using the ExoView platform. The graph shows the particle number and fluorescent intensity of sEVs captured by the CD63/CD81/CD9 probe, and detected by CD63/CD81/CD9 fluorescent antibodies in representative sEV samples.

