Figure 5.
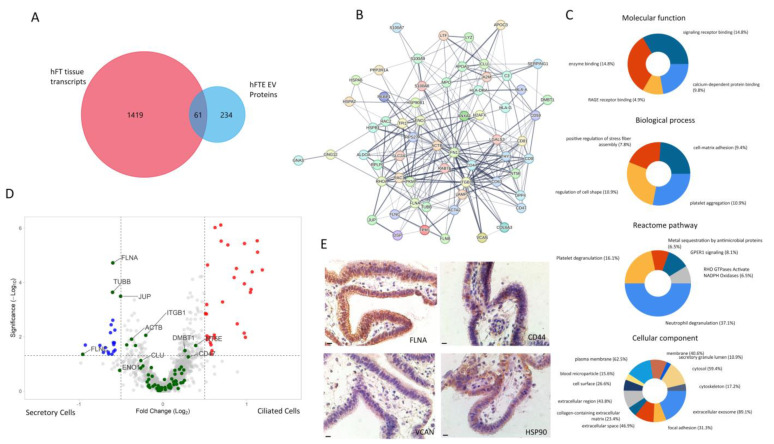
Correlation of fallopian tube tissue transcriptomics profile with a hFTE sEV proteomics profile. (A) Comparison between hFTE sEV proteins with hFT tissue transcripts (CTA database, GeoMx) of ciliated and secretory cells identified by GeoMx digital spatial imaging showing 61 common gene IDs. (B) Protein−protein interaction network of the 61 common gene IDs via STRING. (C) Gene enrichment analysis of 61 common genes showing molecular functions, biological processes, Reactome pathways, and cellular components associated with 61 common genes, using the FUNRICH software. The percentage in the pie chart description represents the percentage of genes out of 61 common genes responsible for particular events. (D) The differential expression of genes in ciliated vs. secretory cells in fallopian tube tissue. The green dots represent 61 common gene IDs between the hFTE transcriptome and hFTE sEV proteomics. Four (FLNA, TUBB, JUP, and FLNC) out of 61 genes were significantly upregulated in secretory cells. Blue and red dots are differentially expressed genes in secretory and ciliated cells, respectively. (E) IHC staining of representative proteins of 61 common genes expressed in fallopian tube tissue and sEVs. Scale bar = 10 µm.

