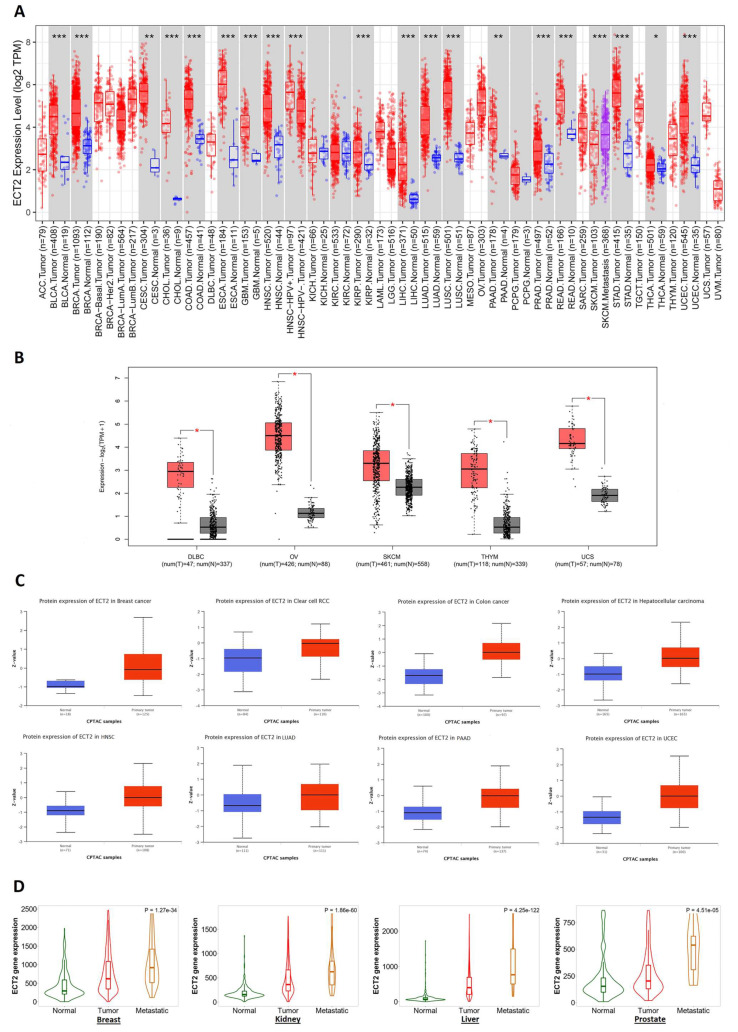
Figure 1.
ECT2 expression assessment in human cancers. (A) Differential expression of ECT2 in a panel of TCGA tumors analyzed by TIMER2.0. (*: p-value < 0.05; **: p-value < 0.01; ***: p-value < 0.001) (B) Tumors experienced a significant elevation in ECT2 expression in tumor versus normal tissue when analyzed in the GEPIA2 database. (*: p-value with a significant score) (C) Tumors experienced a statistically significant higher ECT2 protein expression in the tumor sample versus normal one. (D) Tumors experienced a consistent positive correlation between CHD1L expression and tissue type (normal–tumor–metastatic).

