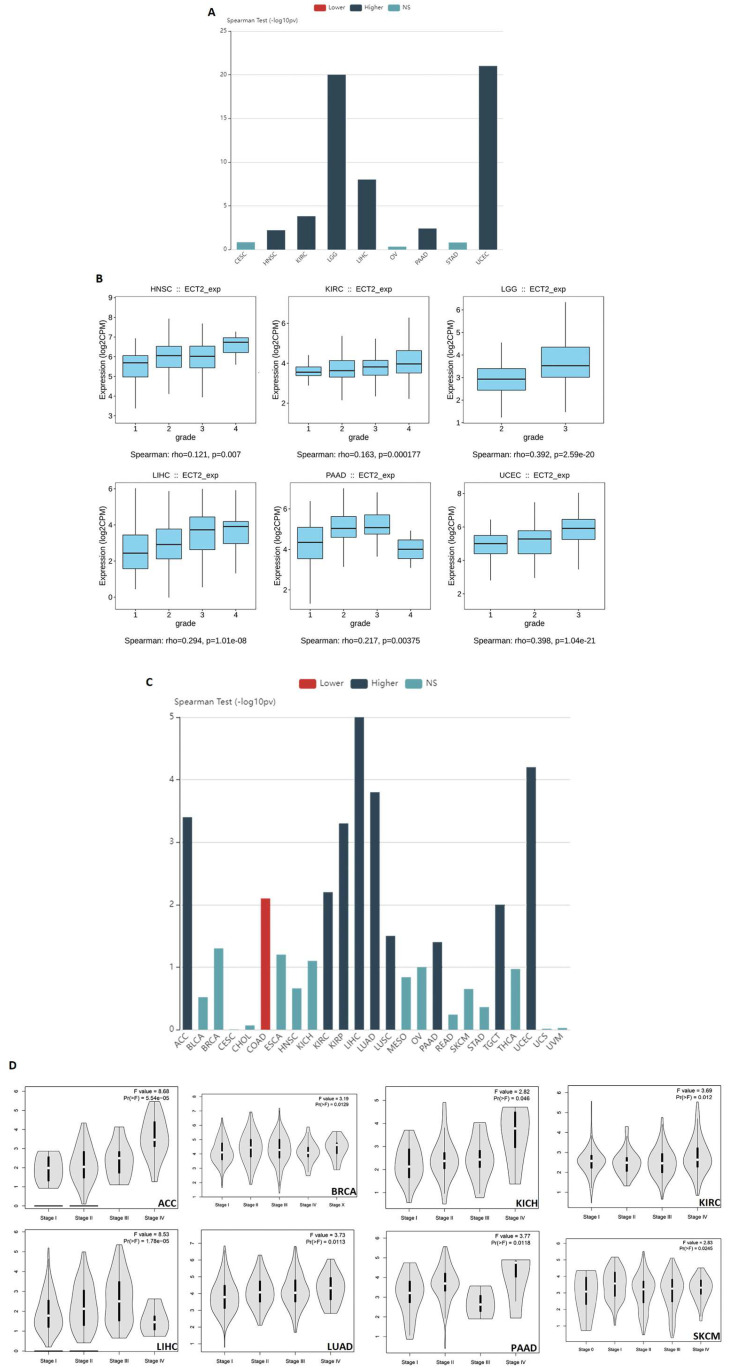
Figure 2.
Correlation between ECT2 level and tumor stage and grade. (A) Bar chart showing the correlation between ECT2 level and tumor grade. (B) Box plot for tumors that experienced a positive correlation between ECT2 level and tumor grade. (C) Bar chart showing the correlation between ECT2 level and tumor stage. (D) Violin plot for tumors that experienced a positive correlation between ECT2 level and tumor stage.

