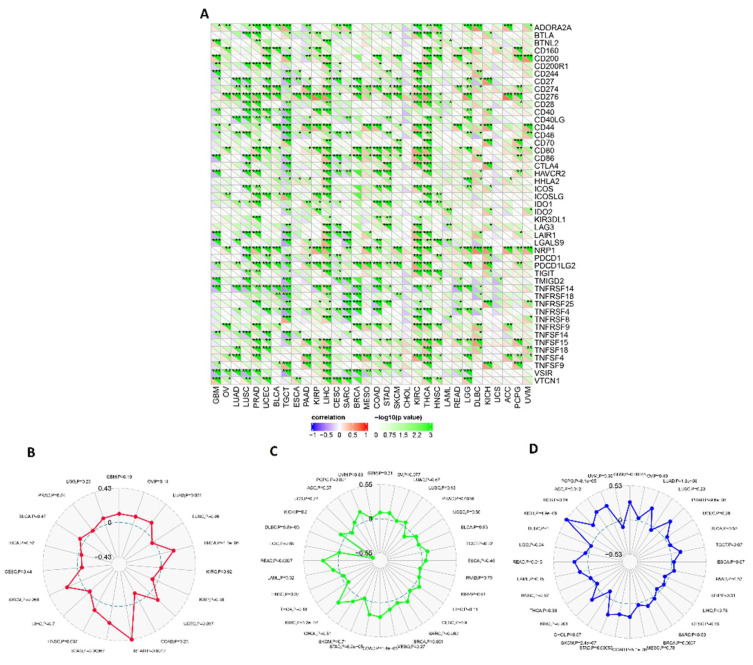
Figure 9.
Correlations of ECT2 expression with immune checkpoints, tumor neoantigens, MSI, and TMB. (A) Heatmap correlating the immune checkpoints and ECT2 across a list of human tumors. (B–D) Radar charts showing the overlaps of ECT2 with tumor neoantigens, MSI, and TMB respectively. (*: p-value < 0.05; **: p-value < 0.01; ***: p-value < 0.001).

