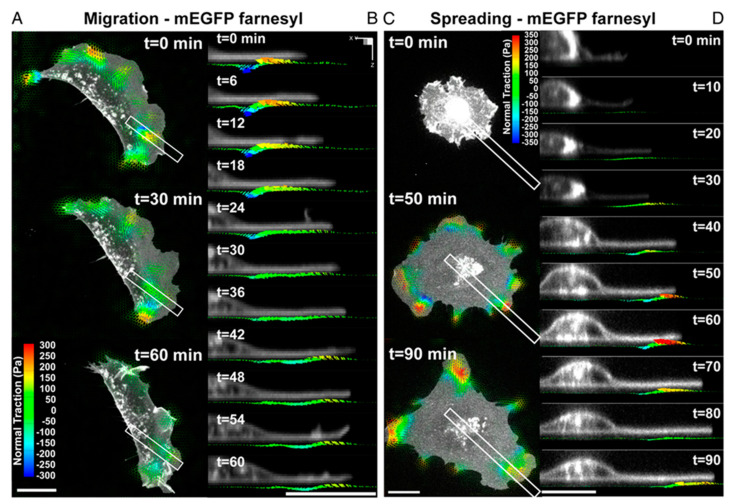
Figure 6.
Dynamic measurements of 2.5D traction stress. (A) Time−lapse images depicting traction stress vectors color−coded by the normal component generated by a migrating MEF expressing mEGFP−farnesyl. As the cell moves (toward right), rotational moments are applied in the protruding front as well as the sides. (B) Time−lapse cross−sectional views of the inset outlined in A showing dynamic rotational moments that move with the thin protruding cellular body during cell migration. (C) Time−lapse images of mEGFP−farnesyl–expressing MEF undergoing spreading. No significant vertical traction stresses are detected until the cell extends thin protrusions and flattens against the substratum. Minimal tractions are detected under the nucleus. (D) Time−lapse cross-sectional views of the inset outlined in C. Comparable to migrating cells, rotating moments progress outward with the leading edge and remain localized to the cell periphery. (All scale bars, 20 μm) Reprinted with permission from ref [119].

