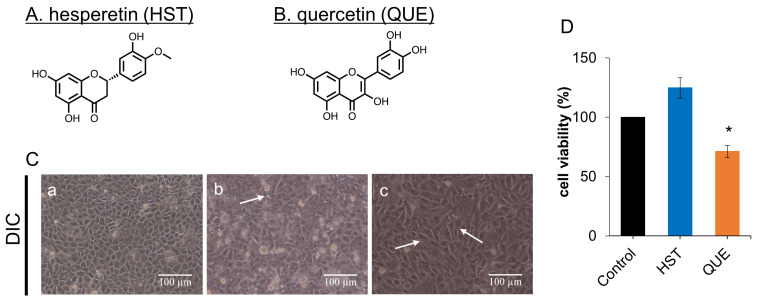
Figure 1.
Chemical structures of (A) hesperetin (HST) and (B) quercetin (QUE). (C) Morphological change in Madin-Darby canine kidney (MDCK) II cells induced by flavonoids. Bright-field differential interference contrasts (DIC) images with corresponding flavonoids that are arrayed. Cells were exposed to flavonoids at a concentration of 100 μM for 48 h. Arrows show the changes. (a) Control (DMSO), (b) HST, and (c) QUE. Scale bar = 100 µm. (D) Effects of flavonoids on cell viability in MDCK II cells. Cells were treated with flavonoids at a concentration of 100 μM for 48 h. Error bars indicate standard deviations. Turkey-Kramer multiple comparison tests were applied as statistical analyses. Difference from the value of the control cells, * p < 0.05. HST, QUE: n = 4.

