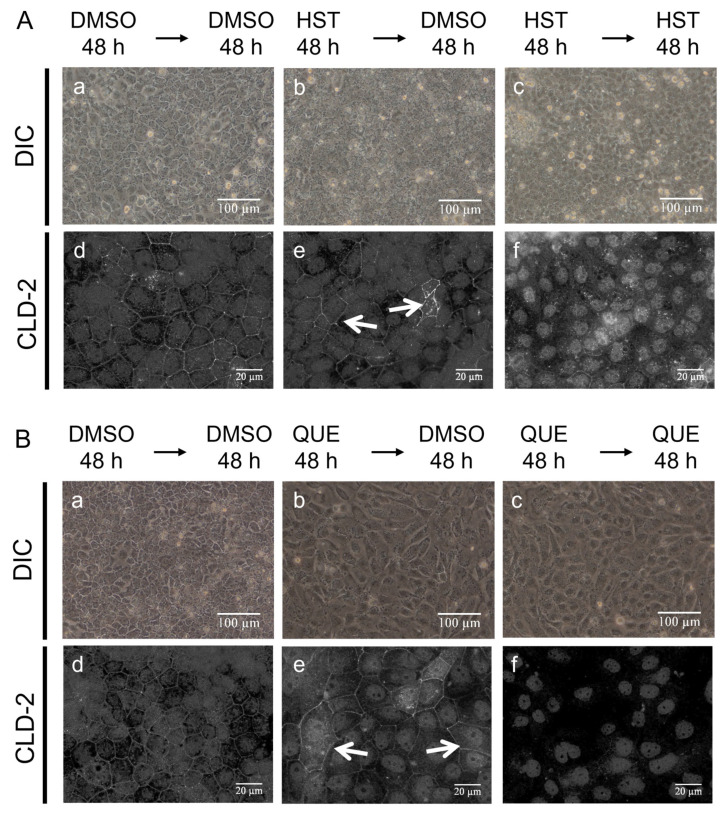
Figure 3.
Partially irreversible changes of morphology and TJ integrity of MDCK II cells induced by (A) HST or (B) QUE. DIC images (a–c) and immunofluorescence-stained images of CLD-2 (d–f) of MDCK II cells are shown. The cells were exposed to HST or QUE at a concentration of 100 μM for 48 h and then treated with HST, QUE, or DMSO at a concentration of 100 μM for 48 h after washing with the medium. (a,d) Control (DMSO–DMSO), (b,e) flavonoid–DMSO, and (c,f) flavonoid–flavonoid. Scale bar = 100 µm (a–c), 20 µm (d–f). For immunofluorescence staining, brightness was modified to 160%. Arrows indicate CLD-2 localized at regenerated tight junctions.

