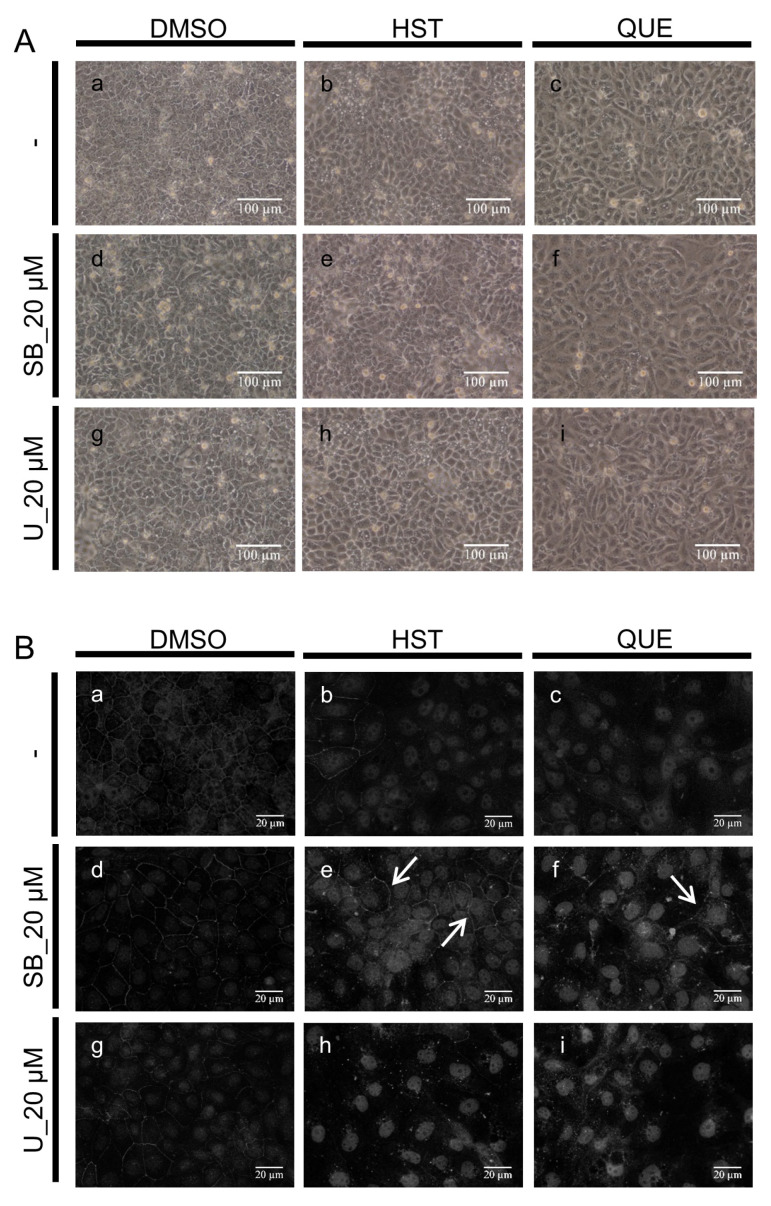
Figure 6.
Effects of flavonoids on the morphology and TJ integrity of MDCK II cells. (A) DIC images with corresponding flavonoids are presented. Cells were exposed to flavonoids at a concentration of 100 μM and/or SB431542 or U0126 20 µM for 48 h. (a,d,g) control (DMSO); (b,e,h) HST; (c,f,i) QUE. Scale bar = 100 µM. (B) Immunofluorescence staining of CLD2 images are shown. Cells were treated with flavonoids at a concentration of 100 μM and/or SB431542/U0126 20 µM for 48 h. (a,d,g) control (DMSO); (b,e,h) HST; (c,f,i) QUE. Scale bar = 20 µM. Brightness is modified to 160%. Arrows indicate CLD-2 localized at partially restored tight junctions.

