Figure 5.
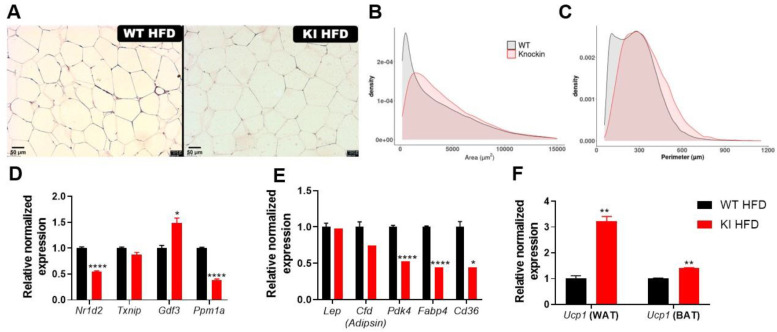
White adipose tissue (WAT) analysis after 18 weeks of high-fat diet feeding. (A) WAT histology after embedding it in paraffin and slides were prepared with 5 µm cuts. Analysis of WAT considering density of adipocytes on each (B) area and (C) perimeter, divided into each group. Relative normalized expression of (D) genes regulated by S273 phosphorylation in WAT: Nr1d2 and Txnip described by Choi in 2010, Gdf3 and Ppm1a described in 2020. (E) Genes involved on PPARγ and lipid metabolism pathways in WAT: leptin (Lep), adipsin (Cfd), Pdk4 (pyruvate kinase dehydrogenase), Fabp4 (fatty acid binding protein 4), and Cd36 (scavenger receptor). (F) Ucp1 expression in WAT and BAT. Data were normalized to the expression of reference genes: 36b4 and Rpl27. Data are represented as mean ± SEM. Statistical analysis was performed using Dunnett’s T3 multiple comparison ANOVA test. * p < 0.05, ** p < 0.01 and **** p < 0.0001. n ≥ 5 per group.

