Figure 1.
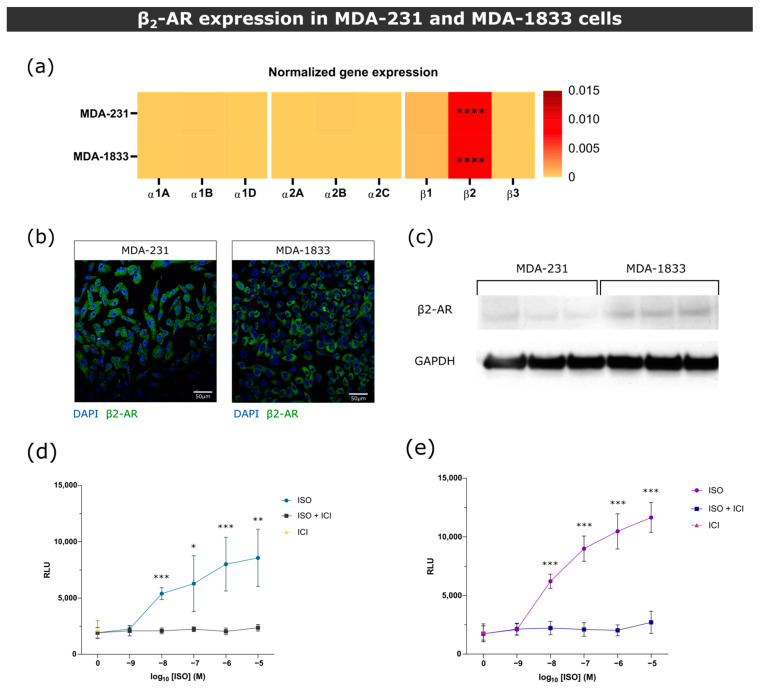
β2-AR gene and protein expression in MDA-231 and MDA-1833 cells. (a) Normalized gene expression of ARs in primary MDA-231 and metastatic MDA-1833 cell lines performed by real time PCR. One-way ANOVA with Holm–Šídák’s multiple comparison test was used to compare β2-AR expression to every other ARs in MDA-231 or MDA-1833 (n = 6, **** p < 0.0001). No significant differences were found in AR expression between MDA-231 and MDA-1833 cells (two-way ANOVA with Šídák’s multiple comparison test). (b) Representative micrograph of the expression of β2-AR on MDA-231 cells (left) and MDA-1833 cells (right) by immunocytochemistry. Nuclei—blue; β2-AR—green. Scale bar—50 μM. (c) Expression of β2-AR on MDA-231 and MDA-1833 cells by Western blot. Uncropped blot can be found in Figure S4. (d) Stimulation of MDA-231 or (e) MDA-1833 cells with ISO results in cAMP accumulation, which is abrogated by the incubation with 1 μM ICI. Data were generated from three experiments performed in triplicate (Mann–Whitney test, * p < 0.05, ** p < 0.01, *** p < 0.001).

