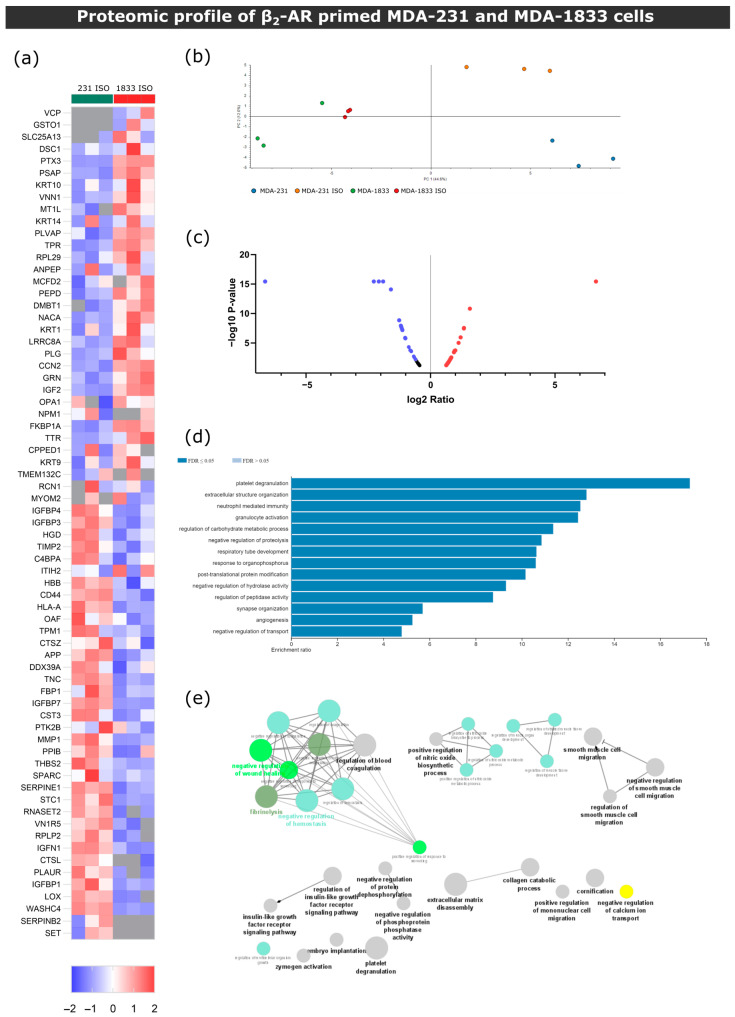
Figure 7.
β2-AR signaling leads to different outcomes in parental MDA-231 or bone tropic MDA-1833 cells. (a) Heatmap depiction of significantly deregulated proteins found in conditioned medium from control or ISO-treated MDA-231 and MDA-1833 cells (Student’s t-test, p ≤ 0.05). The ratio of protein abundances was color coded as shown in the legend. Data from three independent samples are shown, one sample per column. Gray cells represent proteins not detected in a particular sample. (b) PCA of deregulated proteins between MDA-231 and MDA-1833, both in the control and ISO-treated conditions. (c) Volcano plot distribution of significantly deregulated proteins in ISO-treated MDA-1833 and ISO-treated MDA-231 samples. The ratio between protein abundances between ISO MDA-1833 cells and ISO MDA-231 cells is plotted on the X axis, and the p-value is plotted on the Y axis. Red dots represent proteins with a fold change ≤ 1.5, while purple dots represent proteins represent proteins with a fold change ≤ −1.5. (d) Significantly enriched biological process terms in the group of deregulated proteins in ISO-treated MDA-1833 and ISO-treated MDA-231 cells. ORA was used and only processes with a false discovery rate of ≤ 0.05 are shown. (e) Gene ontology biological process network analysis of differentially expressed proteins in ISO-treated MDA-1833 and ISO-treated MDA-231 cells is shown. Only networks with p ≤ 0.05 are shown (two-sided hypergeometric test and Bonferroni step-down correction).

