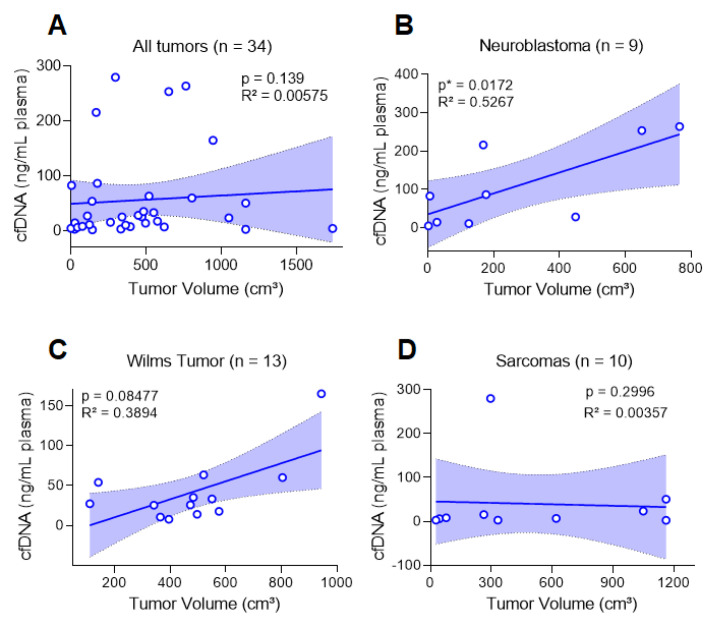
Figure 3.
Correlation between cfDNA ng per mL plasma and tumor volume (Spearman’s correlation and linear regression). (A): cfDNA ng per mL plasma did not correlate with volume when all tumors were used. Considering each tumor type, (B): there was a correlation for neuroblastoma but not for (C): Wilms tumor or (D): sarcomas (Ewing sarcoma, embryonal rhabdomyosarcoma, osteosarcoma and leiomyosarcoma).

