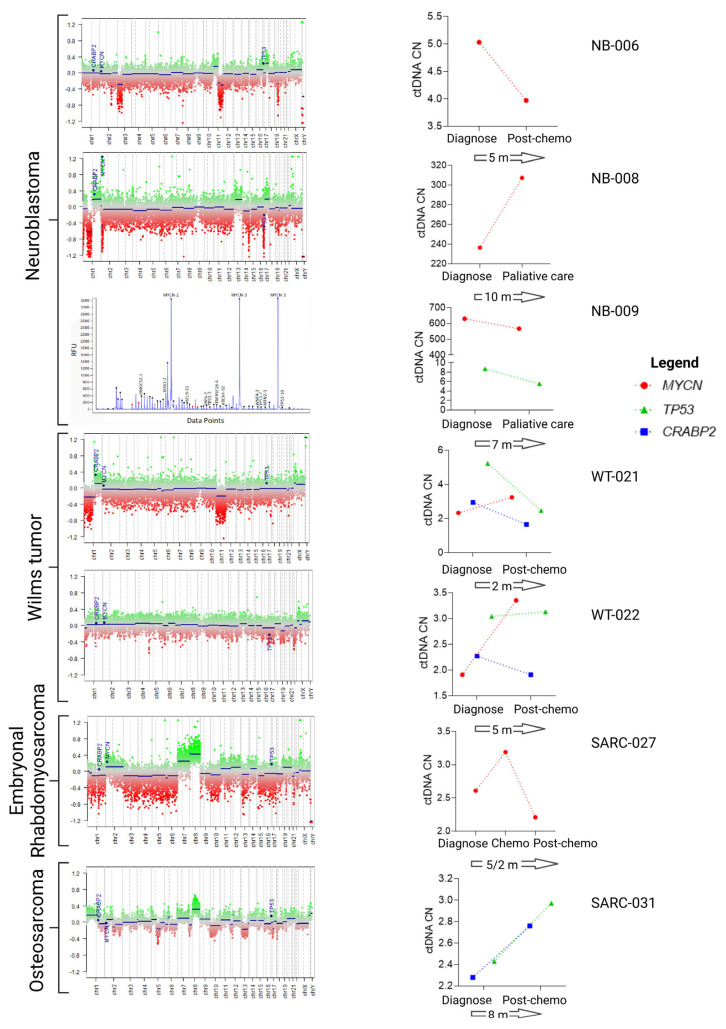
Figure 5.
CtDNA CNA in follow-up samples from seven cases. CNAs in the tumor samples at diagnosis were characterized by methylome or MLPA. Genes evaluated in the ctDNA are labeled in blue. The ctDNA levels at diagnosis and in follow-up samples (graphs on the right) were determined by dPCR. The numbers contained within the arrows represent the time (in months) between the analyses performed at diagnosis and at follow-up. Chemo, chemotherapy.

