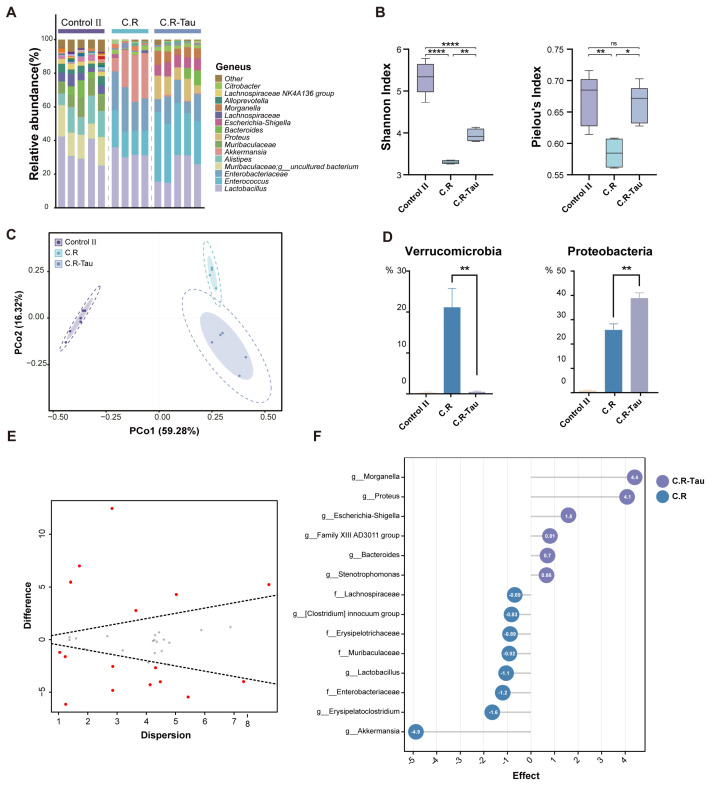
Figure 8.
Taurine supplementation regulates the composition of gut microbiota in C. rodentium−infected mice. (A) The relative abundance of fecal microbiota at the genus level. (B) α-diversity of the microbiota after infection. (C) The Bray−Curtis based PCoA of gut microbiota. The boundary of the dotted ellipse: 95% confidence interval (CI), shadow ellipse: 80% CI. (D) Relative abundances of significantly changed phyla and genera. (E) Effect plot between the C.R−Tau and C.R group based on Aldex2. Features that are statistically significant are in red and those that are non−significant are in grey. (F) Aldex2 analysis of differences in the microbial taxa (Effect size > 0.5) Data are presented as the means ± SEM * p < 0.05, ** p < 0.01, **** p < 0.0001, and p > 0.05 = not significant (ns) by one-way ANOVA followed by Tukey’s test.

