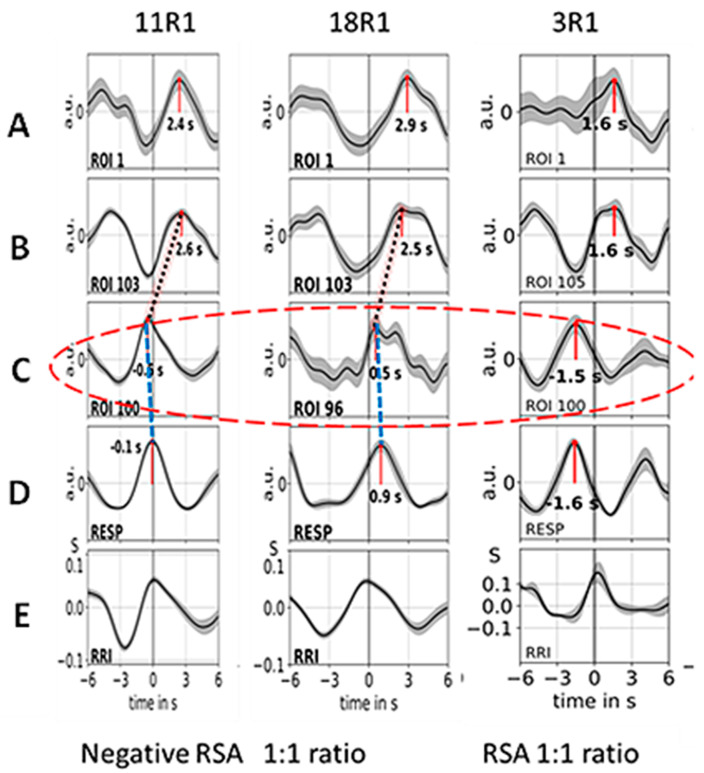
Figure 2.
Examples of ~10 averaged BOLD (A–C), respiration (D) and RRI (E)-peak-triggered waves (mean ± SEM) of the subjects of group 1 (#11, #18, #3). Time intervals are shown from 6 s before to 6 s after the trigger. Numbers indicate the time shift in seconds between the peak and trigger. The red ellipse marks respiratory motion artefacts of the BOLD signal. The time shifts between breathing (line D) and respiratory BOLD artefacts (ROIs 96, 100; line C) are indicated by blue stippled lines, and the time shifts between respiratory BOLD artefacts and associated neural BOLD waves (ROI 103, 105; line B) are indicated by red stippled lines (only in the first two columns). The coherent breathing and RRI waves (lines D and E) in the first two subjects (#11, #18) indicate negative RSA (nRSA) while the out-of-phase behavior of breathing and RRI waves in the third column (subject #3) is characteristic for classical (positive) RSA (modified from [70]).

