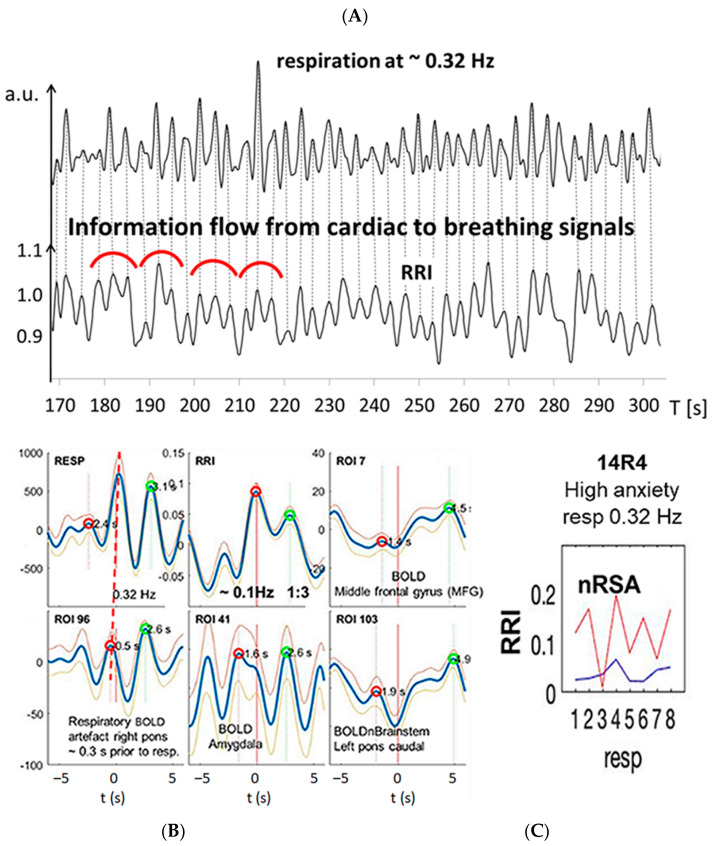
Figure 5.
Example from subject #14 with dominant fast respiration in the 0.2–0.4 Hz band. (A) Records of respiratory and RRI waves. Some RRI periods with 1:3 coupling are marked with red semi-circles, indicating superposition of fast wavelets at ~0.3 Hz originating from the respiratory rhythm on slow RRI waves at ~0.1 Hz. (B) RRI peak (longest RR interval)-triggered respiratory (resp), RRI and slow BOLD waves (mean ± SEM; more details, see text). (C) The information flow diagram indicates a predominant flow from RRI to respiration. For further explanations, see Figure 3.

