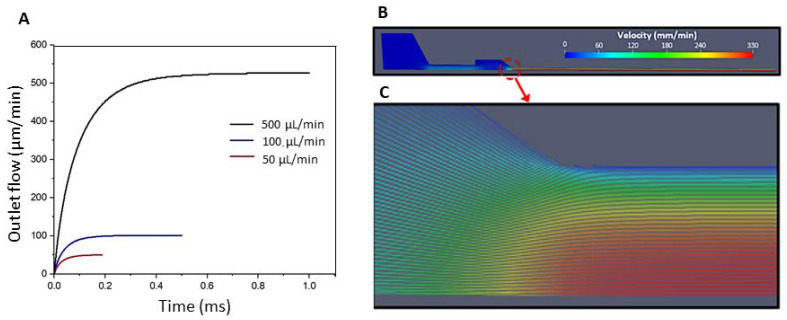
Figure 8.
(A) Outflow rates for kinematic inlet pressures 6.4, 9, and 20 m2/s2 led to steady state flow rates of 50, 100, and 500 μL/min, respectively. (B,C) Variation of the velocity magnitude along the geometry. (B) Velocity profile for a feed rate of 100 μL/min and needle size 0.8 mm. (C) Streamlines.

