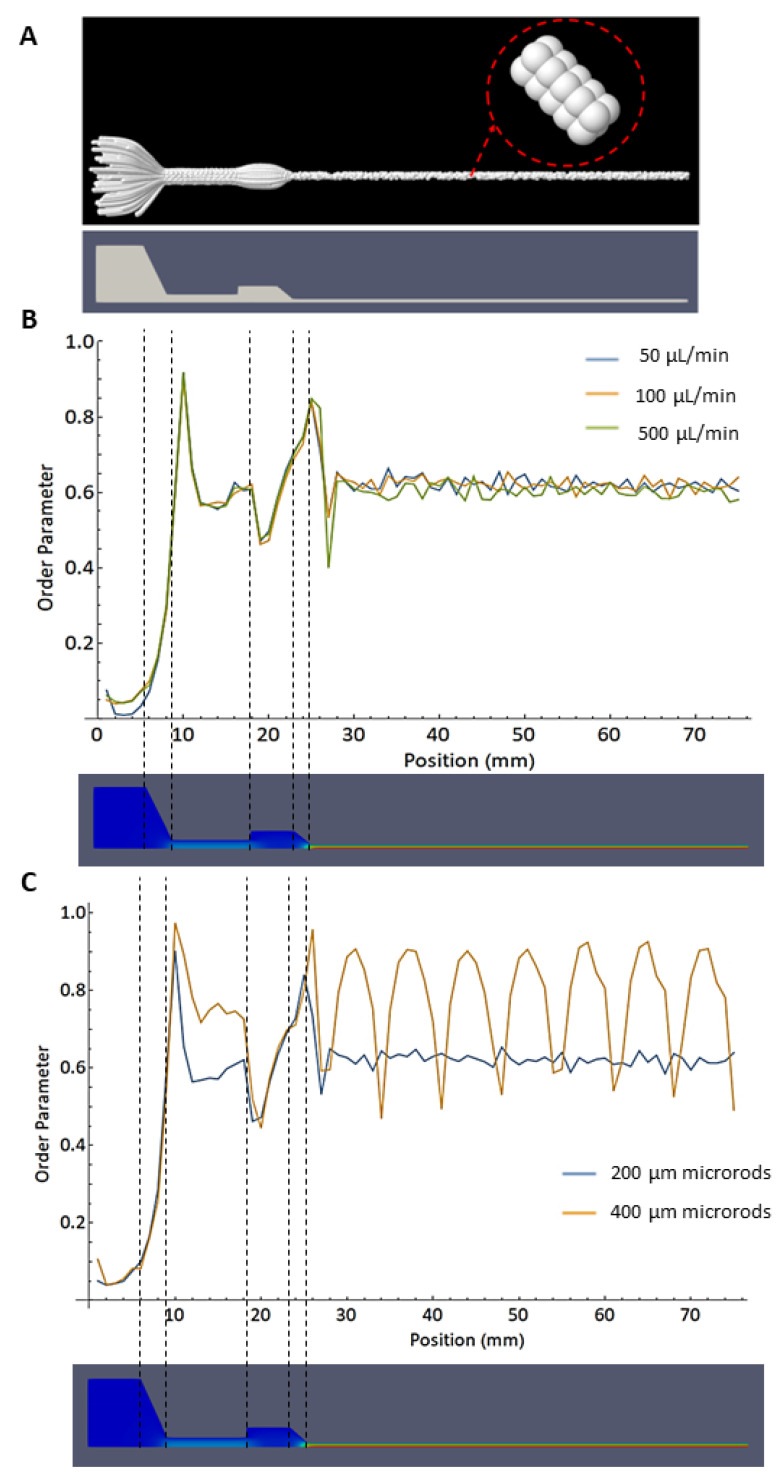
Figure 10.
(A) Simulation with 100 microrods of 200 μm length. Multiple time steps are overlapped to observe the trajectory they follow. Variations of the orientational order parameter S (see Equation (10)) along the geometry, calculated for (B) 50, 100, and 500 μL/min flow rate (constant parameters: 200 μm microrods, needle diameter 0.8 mm) and (C) microrod’s lengths of 200 and 400 μm (constant parameter: 100 μL/min flow rate). For comparison, the contour of the syringe and needle is shown below.

