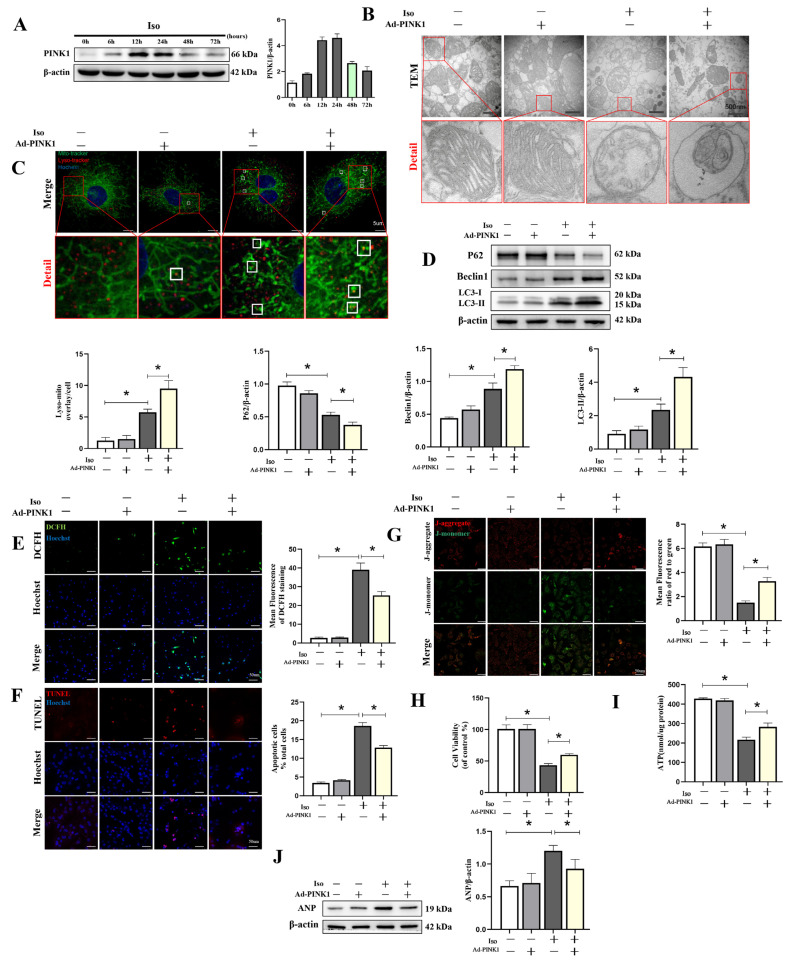
Figure 1.
Overexpression of PINK1 attenuated isoprenaline-induced cardiomyocyte injury by mitophagy. Adenoviruses Ad-PINK1 and Ad-control were used to transfect cardiomyocytes and then stimulated with Iso (10 uM) for 48 h. (A) Western blot showing the expression of PINK1 over time. (B) Mitochondrial morphology was shown by TEM in cardiomyocytes. Details of mitochondrial structures are shown in the red frame. (C) Representative immunofluorescence images of lysosomal–mitochondrial interactions (yellow). Lysosomes are shown in red, mitochondria are shown in green, and nuclei are shown in blue. (D) Western blot showing the expression levels of P62, Beclin1 and LC3 II in each group. Quantification relative to β-actin levels. (E) DCFH staining was used to show ROS production (green) in cardiomyocytes. (F) Apoptotic cardiomyocytes (red) were examined by TUNEL staining. (G) Fluorescence images of MMP detected by JC-1 tracker. J-aggregate staining is shown in red and J-monomer staining is shown in green. (H) Cell viability was detected by the Cell Counting Kit-8 (CCK-8). (I) ATP assay kit with a luminometer was used to determine intracellular ATP levels. (J) Immunoblotting showing the expression of ANP in cardiomyocytes. Statistical analyses (A–J) were performed by one-way ANOVAs followed by Dunnett’s test post-hoc tests. Data are presented as the mean ± SD. (n = 3). * p < 0.05.

