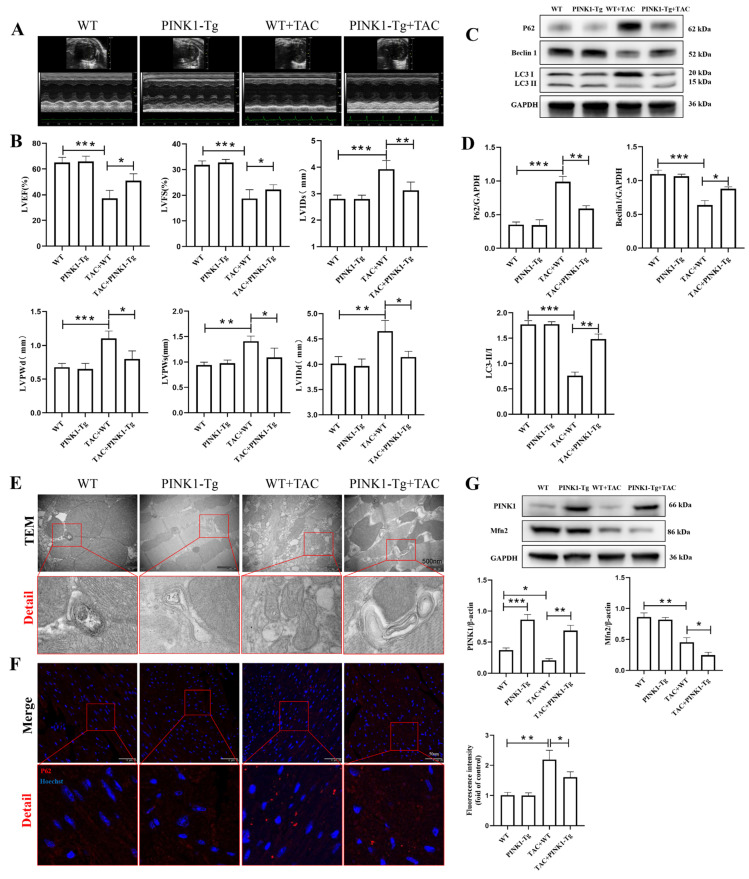
Figure 3.
Effect of PINK1 overexpression on cardiac function and mitophagy in TAC mice. The echocardiography (ECG) was administrated at 8 w after surgery (A,B): LV ejection fraction (EF), LV fraction shortening (FS), left ventricular internal dimension in systole (LVIDs), left ventricular internal dimension in diastole (LVIDd), left ventricular posterior wall in systole (LVPWs), left ventricular posterior wall in diastole (LVPWd). n = 6 for each group. (C,D) Immunoblotting showing the expression of P62, Beclin 1 and LC3II in WT and PINK1-Tg mice. Densitometric analyses of the Western blotting results, P62 to GAPDH, Beclin1 to GAPDH, and LC3II to LC3I. (E) The autophagosome was shown by TEM in myocardial tissues. Details of mitochondrial structures are shown in the red frame (scale bars 500 nm). (F) Immunofluorescence staining of p62 expression (red) in myocardial tissues (scale bars 50 μm). (G) Immunoblotting showing the expression of PINK1 and Mfn2 in WT and PINK1-Tg mice. Statistical analyses (A–G) were performed using one-way ANOVAs followed by Bonferroni test post-hoc tests. *: p < 0.05, **: p < 0.01, ***: p < 0.001, values are presented as the mean ± SD, n = 3.

