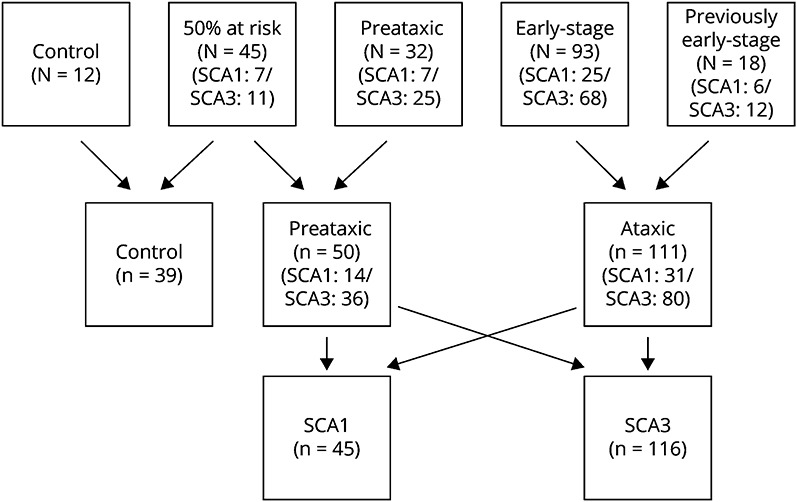
Figure 1. Flowchart With the Distribution of the 200 Individuals Included According to the Inclusion Target Groups, the Studied Categories, and the Genotype Groups.

SCA1 = spinocerebellar ataxia type 1; SCA3 = spinocerebellar ataxia type 3.

SCA1 = spinocerebellar ataxia type 1; SCA3 = spinocerebellar ataxia type 3.