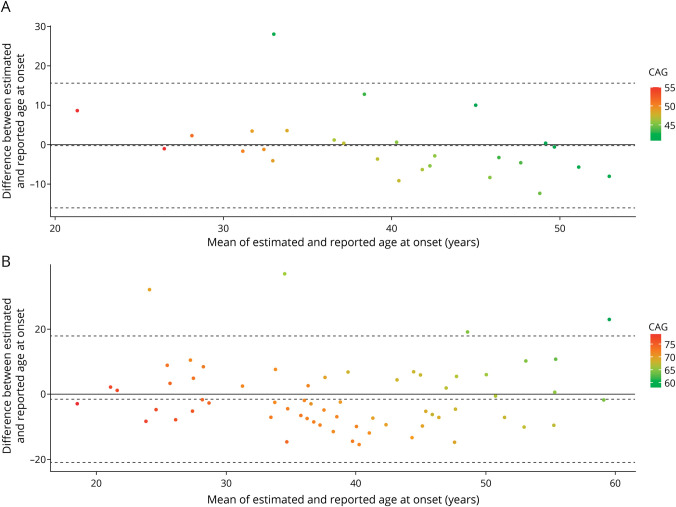
Figure 3. Plot of Differences Between the Estimated Age at Ataxia Onset and the Reported Age at Onset vs the Mean of the 2 Measurements for Patients With SCA1 (Panel A) and SCA3 (Panel B).
The solid line corresponds to the absence of differences. The bias (dotted lines) is −0.26 (−16.10 to 15.6) for SCA1 and −1.54 (−21.00 to 17.91) for SCA3. SCA1 = spinocerebellar ataxia type 1; SCA3 = spinocerebellar ataxia type 3.

