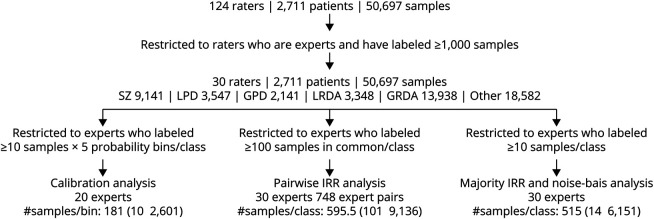
Figure 1. Scoring Flowchart.
In total, 124 raters (30 experts and 94 technicians or trainees) scored 50,697 segments from 2,711 patients' EEG recordings. The number of segments among these with consensus labels of seizure (SZ), lateralized or generalized periodic discharges (LPDs, GPDs), lateralized or generalized rhythmic delta activity (LRDA, GRDA), or none of those patterns (“other”) are indicated. Constraints applied to ensure statistical stability for calibration analysis, pairwise interrater reliability (IRR) analysis, and majority IRR analysis are shown, together with the resulting number of experts' data, and the number of segments is shown. For calibration analysis, the number of segments available is expressed as the median [minimum, maximum] number of segments per probability bin. For pairwise and majority IRR, the number of segments is given as the median [minimum, maximum] number of segments per pattern class. For pairwise IRR analysis, the number of expert pairs among the 30 experts with sufficient jointly scored data for analysis is also shown.

