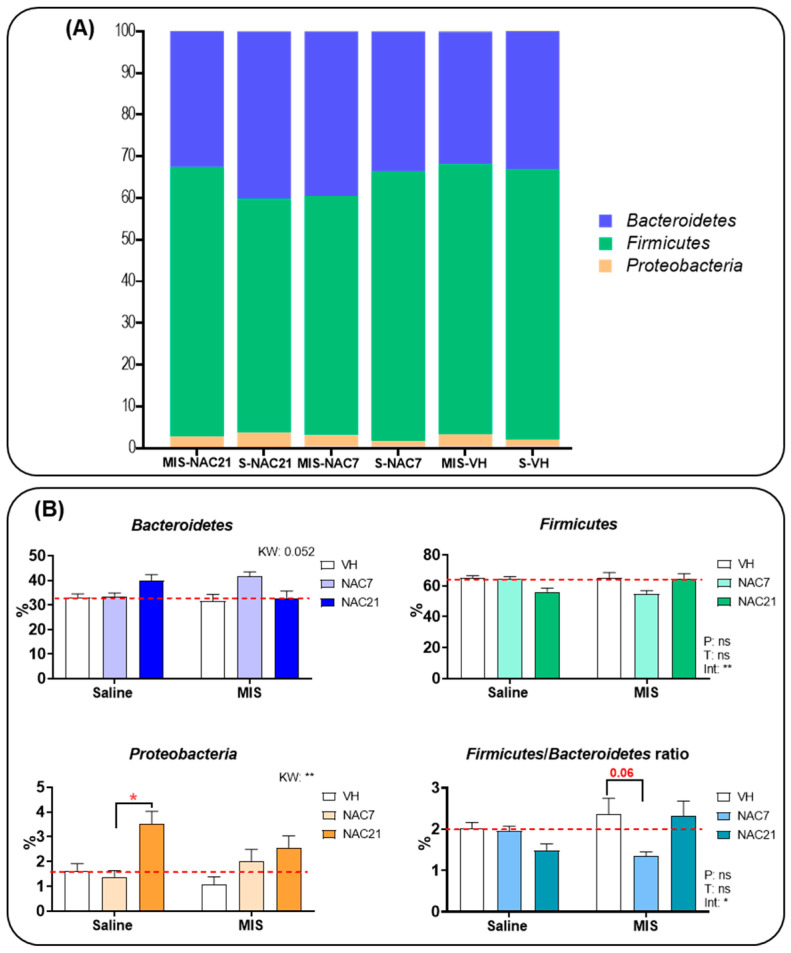
Figure 2.
(A) The nested bar at the phylum level. The nested bar graph shows the mean percentage composition of the most representative phyla for each group. Bacteroidetes (purple), Firmicutes (green) and Proteobacteria (orange) were the most common phyla. (B) Gut microbiota composition at the phylum level. Graphs show the mean percentage composition of the 3 most representative phyla and the Firmicutes/Bacteroidetes ratio in the Saline and MIS animals treated with NAC during gestation. (Saline VH, N = 8; Saline NAC7, N = 11; Saline NAC21, N = 11; MIS VH, N = 11; MIS NAC7, N = 11; MIS NAC21, N = 11). Data are shown as mean ± SEM. 2-way ANOVAs followed by Tukey posthoc test or Kruskal–Wallis (KW) analysis followed by Dunn’s multiple comparison are shown (* p < 0.05, ** p < 0.01) [ns: non-significant, P: Phenotype, T: Treatment, int: Interaction]. The red dotted line indicates the mean value of the control group (Saline-VH).

