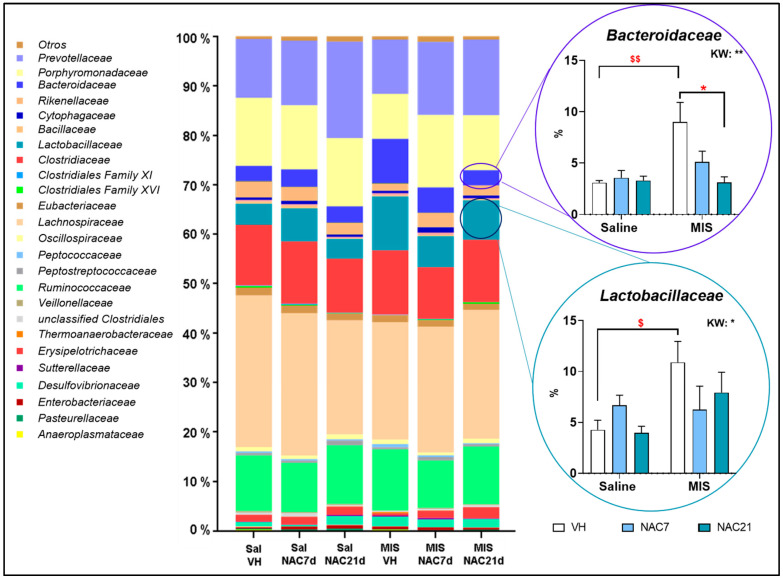
Figure 3.
Nested bar plot showing gut microbiota composition at the family level. Differences in average intestinal microbiota composition at the family level. The nested bar graph shows the mean percentage composition of the most representative families for each group. A higher proportion of Bacteroidaceae and Lactobacillaceae families was found in MIS-VH animals compared to the control group (Sal-VH), which was prevented by NAC treatment. Kruskal–Wallis (KW) analysis followed by Dunn’s multiple comparison test (* p < 0.05, ** p < 0.01) and Mann–Whitney test ($ p < 0.05, $$ p < 0.01) are shown.

