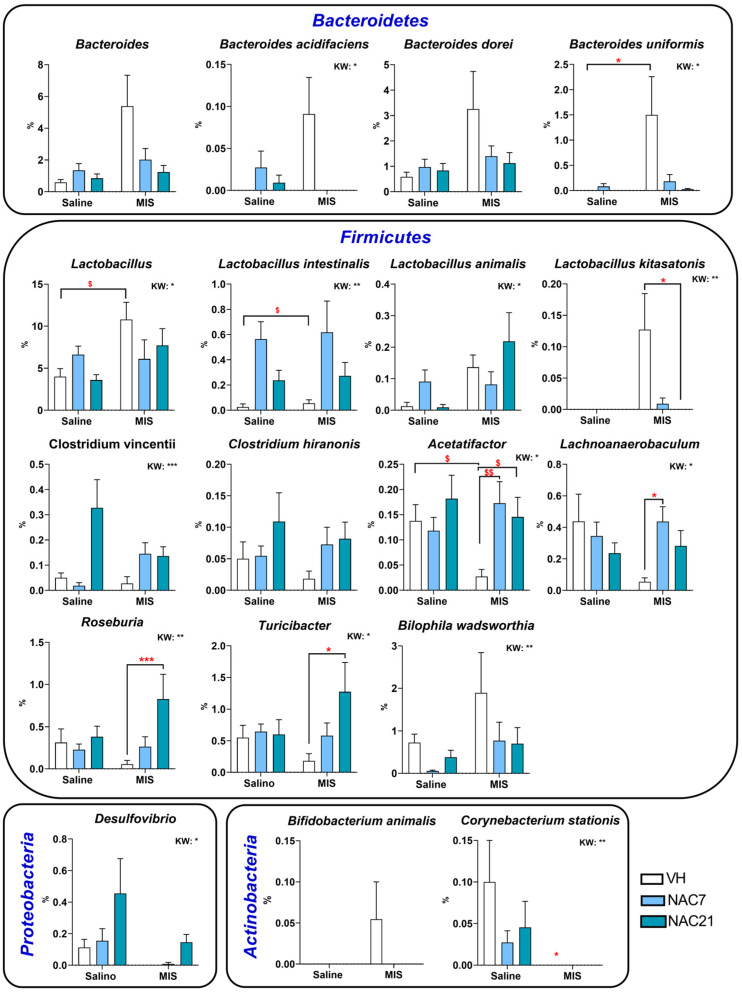
Figure 5.
Selection of the most representative genus and species altered in the MIS model and modified by NAC treatment. Each column shows the average of % changes in the composition of microbiota at the genera and species level. Data are shown as mean ± SEM. Kruskal–Wallis (KW) analysis followed by Dunn’s multiple comparison test (* p < 0.05, ** p < 0.01, *** p < 0.001) and Mann–Whitney test ($ p < 0.05, $$ p < 0.01) are shown.

