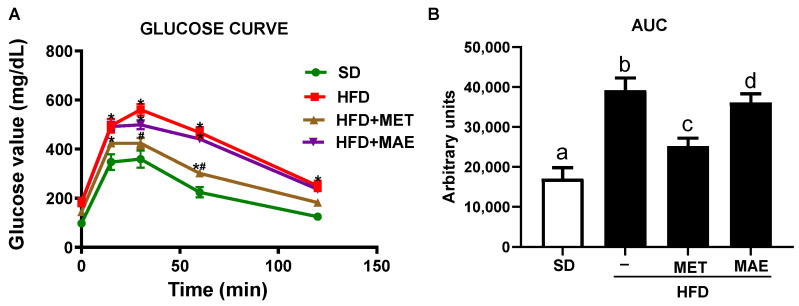
Figure 3.
Mice fed with HFD and treated with metformin (MET) or Morus alba L. extract (MAE) presented lower blood glucose levels than untreated mice fed with the same diet. (A) Glucose curve representation of IPGTT. (B) Area under the curve representation of glucose curve. Data are expressed as means ±SEM (n = 8). * p < 0.05 vs. control SD mice and # p < 0.05 vs. control HFD mice. Groups with different letters statistically differ (p < 0.05). SD: standard diet; HFD: high-fat diet.

