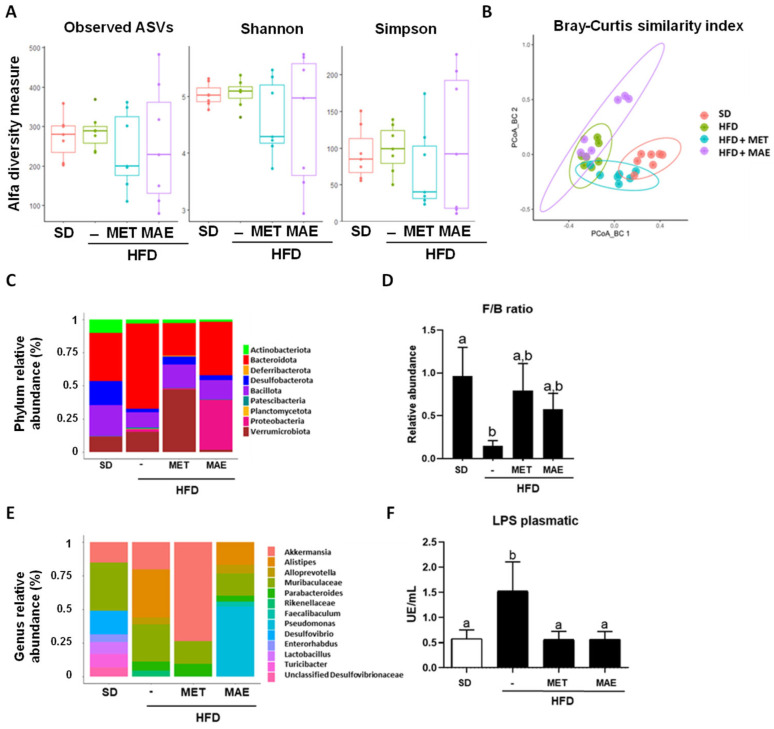
Figure 7.
Analysis of gut microbiota composition revealed that treatment with metformin (MET) or Morus alba L. extract (MAE) restored dysbiosis produced by the HFD administration. (A) Alpha diversity index quantification. (B) Beta diversity index represented by Bray–Curtis distance. (C) Relative abundance at phylum level. (D) Quantification of F/B ratio. (E) Relative abundance at genus level. (F) Quantification of plasma LPS levels. Data are expressed as means ±SEM (n = 8). Groups with different letters statistically differ (p < 0.05). SD: standard diet; HFD: high-fat diet.

