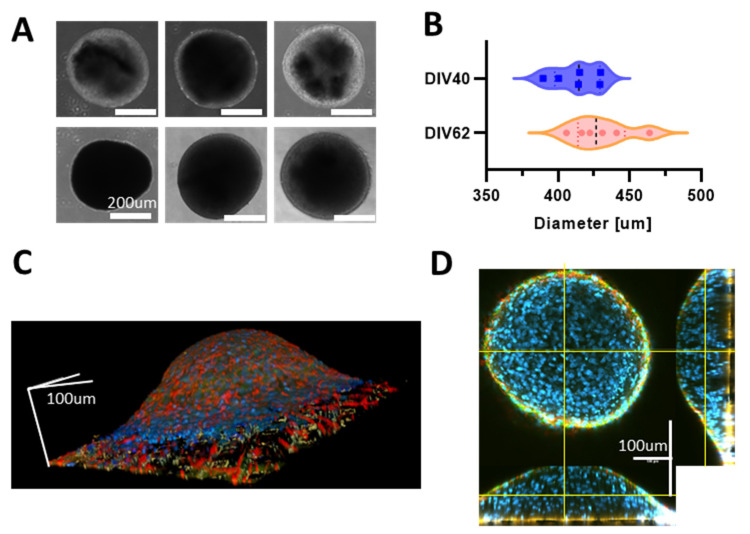
Figure 2.
(A) Images of different neurospheroids in the free culture during development. The first row shows pictures obtained at DIV 40 and second row at DIV 62. Scale bar, 200 µm. (B) Evaluation of the mean diameter of n = 6 neurospheroids at DIV 40 and DIV 62 in the free culture. (C) Reconstruction of the 3D volume of a neurospheroid plated on a HD-MEAs at DIV 35 and fixed at DIV 62. Images were acquired with a confocal microscope using a z-stack of scale bars that represent 100 µm in each direction. (D) Orthogonal view of the sample shown in (B). Yellow lines represent the observation plane. In blue: DAPI, green: MAP2, red: GFAP. Scale bars represent 100 µm in each direction.

