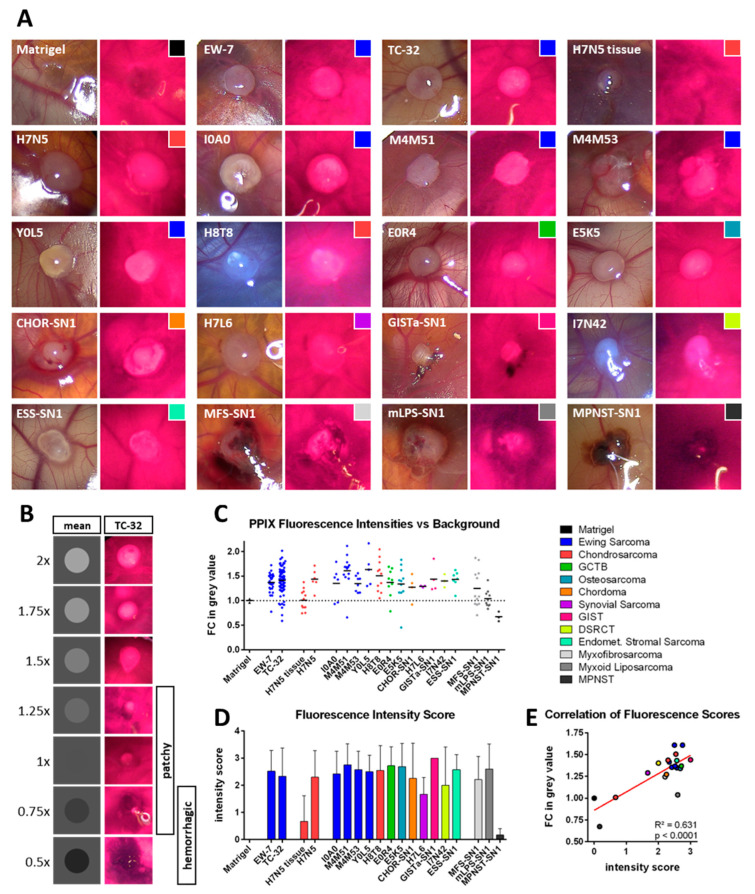
Figure 1.
Photodynamic Diagnosis of Sarcoma xenografts on the chorio-allantoic membrane. (A) Overview of representative images of sarcoma xenografts upon white light (left images) and blue light (405 nm; right images) excitation. PPIX fluorescence presents as pinkish red. (B) For data visualization purposes, fold changes (FC) in mean grey values are depicted as grey circles on a grey background. TC-32 tumors with corresponding fluorescence intensities are shown adjacently. Tumors with an FC in mean grey value between 0.75 and 1.25 showed in most cases a patchy/partial fluorescence, while values below 1 were associated with a hemorrhagic phenotype. (C) FCs in mean grey value between tumors and their surrounding CAM tissue were calculated for all tested xenografts and cell-free Matrigel® as a control. (D) A fluorescence intensity score was determined qualitatively for each tumor visually while performing PDD. Mean intensity scores with the respective standard deviation are depicted. (E) Correlation of mean values of both intensity scores from (C,D). The legend shows the color code for the different sarcoma subtypes and is shared by (A,C–E).

