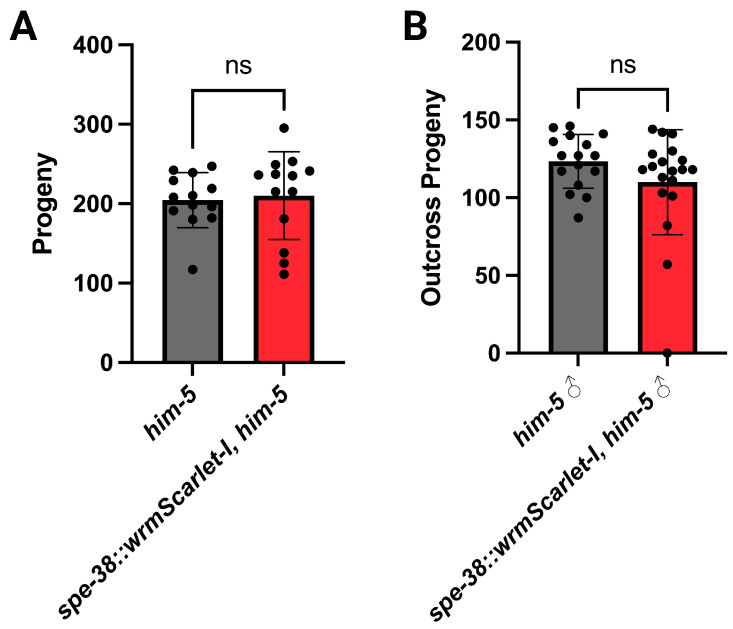
Figure 2.
The fertility of genome edited hermaphrodites (A) and males (B). The fertility of hermaphrodites and males expressing SPE-38::wrmScarlet-I are not significantly different from non-genome edited controls. In all experiments n > 10 animals. The gray (wild-type) and red (genome edited) histogram bars represent the average number of progeny produced. Black dots represent the brood counts for individual hermaphrodites (A) or outcross progeny produced (B). Error bars represent the standard deviation (SD). For hermaphrodite and male fertility, two-tailed unpaired Student’s t-test, p > 0.05 indicates not significant (ns).

