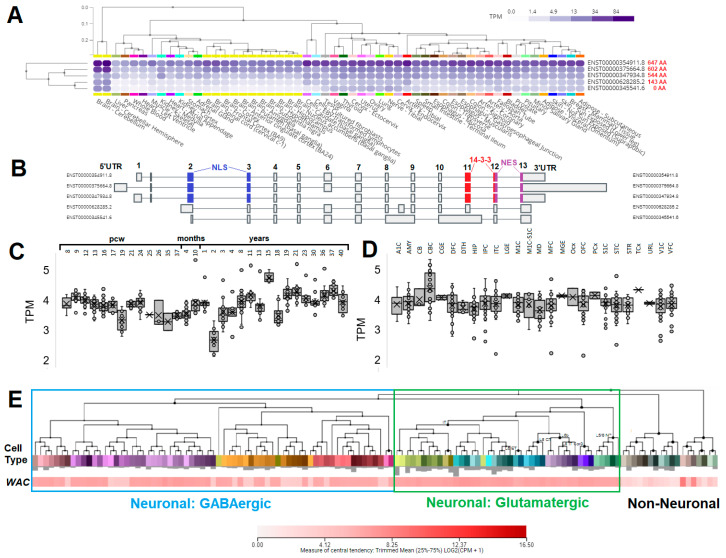
Figure 4.
Analysis of WAC expression in various tissues, the brain developmental times, and within single-cell types of human brain. (A) GTEx expression of WAC isoforms in various human tissues. The darker blue color represents higher expression. Tissues are ranked in expression. In red next to each isoform number is the amino acid size of the protein. (B) Annotated exons of each isoform as shown in panel A. In blue are exons that code for the NLS, red the 14-3-3 interaction site, and magenta the NES. (C,D) The developmental transcriptome data of BrainSpan shown as box and whisker plots of age (C) or tissue type (D). Abbreviations include: pcw- post-coital weeks, A1C—primary auditory cortex (core), AMY—amygdaloid complex, CB—cerebellum, CBC—cerebellar cortex, CGE—caudal ganglionic eminence, DFC—dorsolateral prefrontal cortex, DTH—dorsal thalamus, HIP—hippocampus (hippocampal formation), IPC—posteroventral (inferior) parietal cortex, ITC—inferolateral temporal cortex (area TEv, area 20), LGE—lateral ganglionic eminence, M1C—primary motor cortex (area M1, area 4), M1C-S1C—primary motor-sensory cortex (samples), MD—mediodorsal nucleus of thalamus, MFC—anterior (rostral) cingulate (medial prefrontal) cortex, MGE—medial ganglionic eminence, Ocx—occipital neocortex, OFC—orbital frontal cortex, PCx—parietal neocortex, S1C—primary somatosensory cortex (area S1, areas 3,1,2), STC—posterior (caudal) superior temporal cortex (area 22c), STR—striatum, TCx—temporal neocortex, URL—upper (rostral) rhombic lip, V1C—primary visual cortex (striate cortex, area V1/17), VFC—ventrolateral prefrontal cortex, TPM—transcripts per million. (E) Single-cell expression from the Allen Brain Atlas Human MTG-10X (SEA-AD) data. Deeper red represents higher expression of WAC. Clustering shows grouped cells within labeled neuronal groups.

