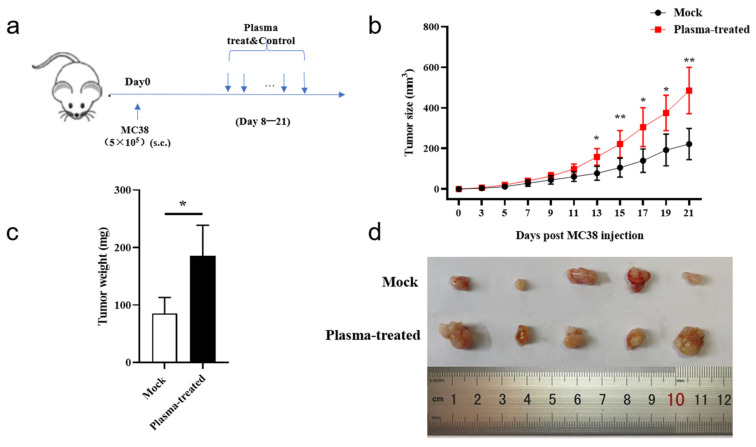
Figure 3.
CAP treatment in vivo facilitates tumor growth in mice. (a) Schematic diagram depicting the tumor-bearing mice and CAP treatment. The mice are subcutaneously injected with 5 × 10⁵ MC38 cells on day 0 and then subjected to CAP treatment from days 8 to 21. (b) Growth curves of the subcutaneous tumors in the mock and PT groups, n = 5. (c) Weight of subcutaneous tumors in the mock and PT groups, n = 5. (d) Images of the tumors on day 21 after implantation of tumor cells. The data are from 15 biologically independent animals (mean ± SD for (b,c)) and the statistical analysis is performed using two-sided unpaired t-tests (* p < 0.05 and ** p < 0.01).

